
Plotting in Divooka

There are four levels of plotting in Divooka:
- Quick, high-level, one-shot plotting
- Slightly more advanced configuration based plotting for standard charts
- Specialized plotting types with varying levels of customization
- In addition to the above three, charts and diagrams written as text with Dhole
At the moment Divooka doesn't have a way for you to draw completely custom plots - if that's desirable, consider using lower level drawing API and image composition API instead.
In this note, we will go through each type below, and for more details, please refer to API doc or library specific documentation.
Summary of Available Plots
(Work in progress)
Standard
| Plot | Location | Purpose | Configurations |
|---|---|---|---|
| Scatter Plot | Quick Plot | Scatter or line chart. | Pending |
Dhole Charts
Each of these is a Dhole text's first word; the kind's page has every word it takes.
| Chart | First word | Page |
|---|---|---|
| Flowchart | flowchart |
Flowcharts |
| Sequence diagram | sequence |
Sequence diagrams |
| State diagram | state |
State diagrams |
| Class diagram | class |
Class diagrams |
| Entity diagram | entity |
Entity diagrams |
| Mind map and organisation chart | mindmap |
Mind maps |
| Timeline | timeline |
Timelines |
| Gantt chart | gantt |
Gantt charts |
| Pie, donut, bar, line, scatter and radar charts | pie, donut, bar, line, xy, radar |
Charts |
| Quadrant chart | quadrant |
Quadrant charts |
| Sankey diagram | sankey |
Sankey diagrams |
| Table and board | table, kanban |
Tables and boards |
1. High Level Quick Plotting
Plotting is typically provided in Plotting > Quick Plot toolbox, with additional configurations in Plotting Configurations category.
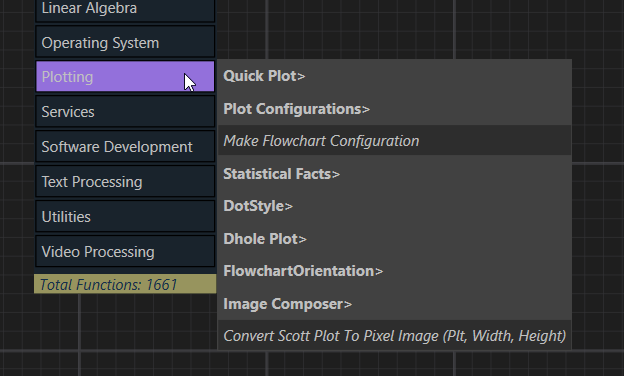
To draw a given plot, pick the plot type node, then supply required parameters.

2. Configuration Based Standard Plots
This method has limitation on the possible type of plots and may become cumbersome for advanced customization.
👉 Download the example source file used in this section
Supported series/objects:
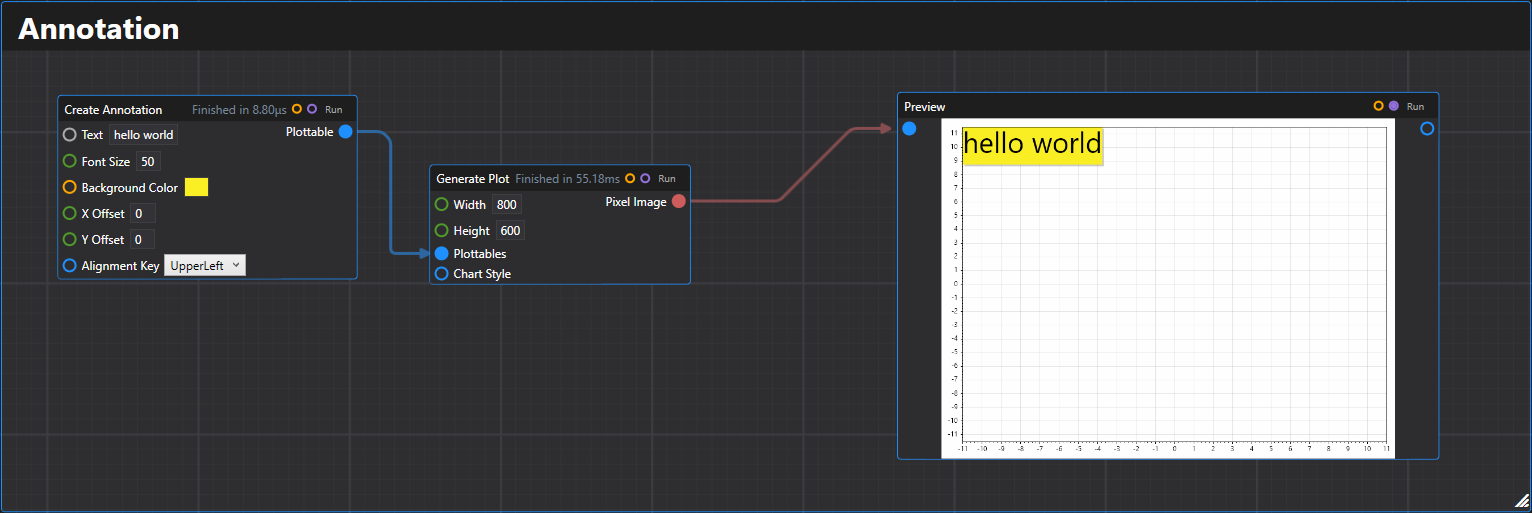
1. Annotation
Creates an annotation text plottable on the chart.
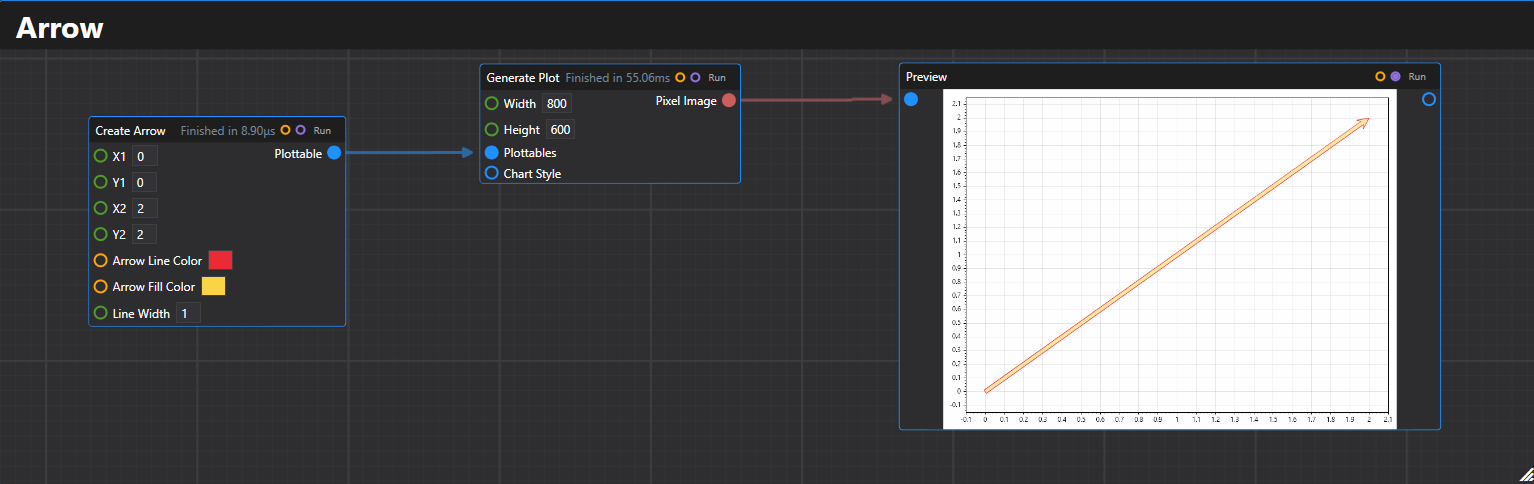
2. Arrow
Creates an arrow plottable with specified start and end coordinates.
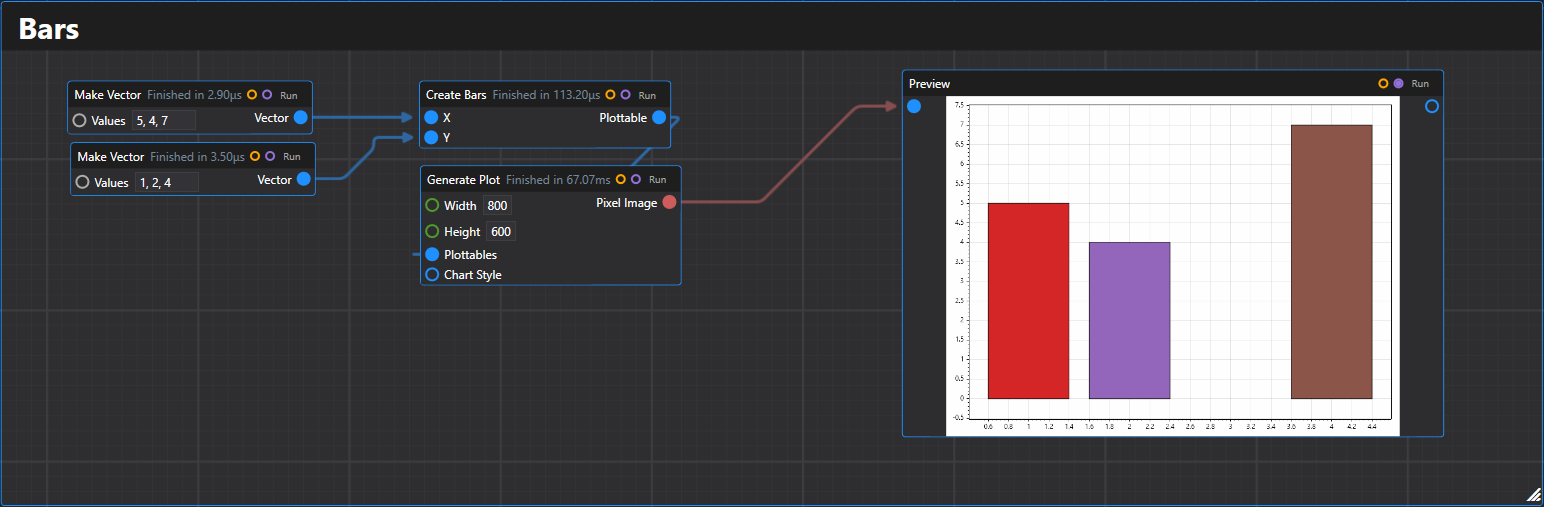
3. Bars
Creates a bar plot plottable from arrays of position and value data.
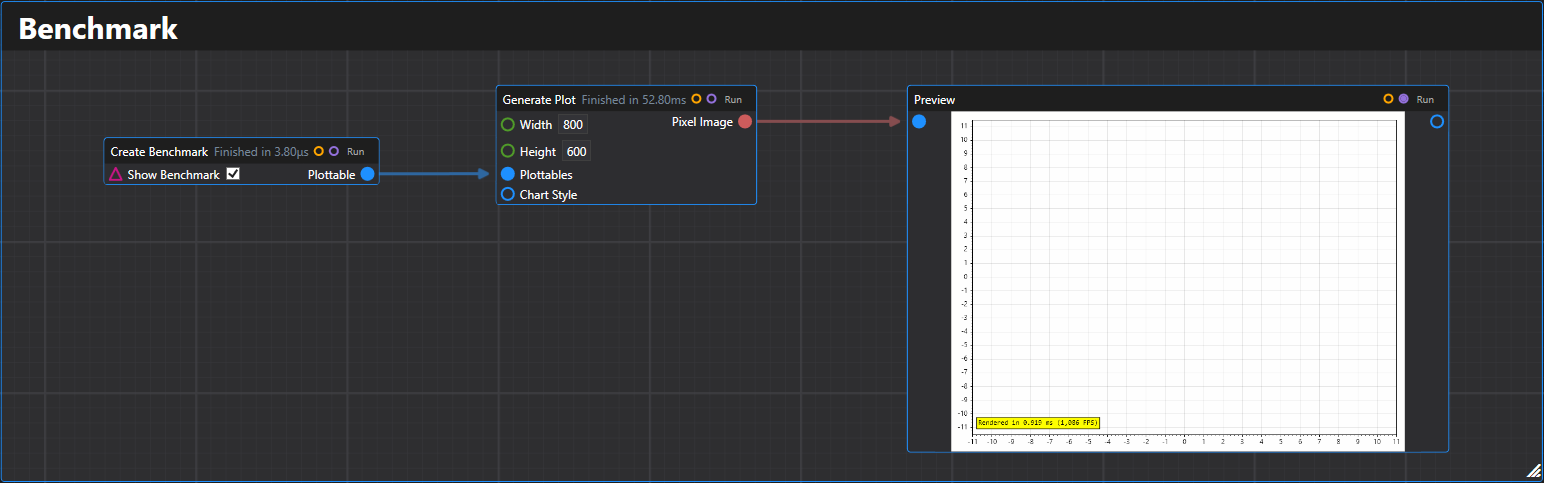
4. Benchmark
Creates a benchmark plottable that displays rendering performance metrics.
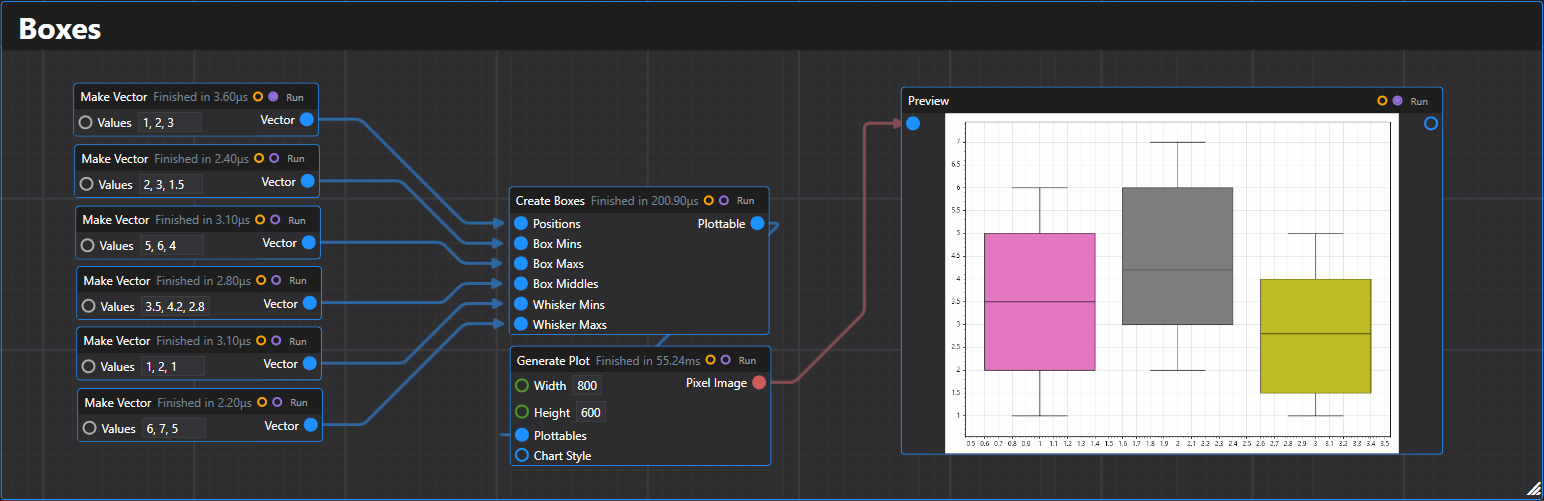
5. Boxes
Creates a box plot plottable from statistical data arrays.
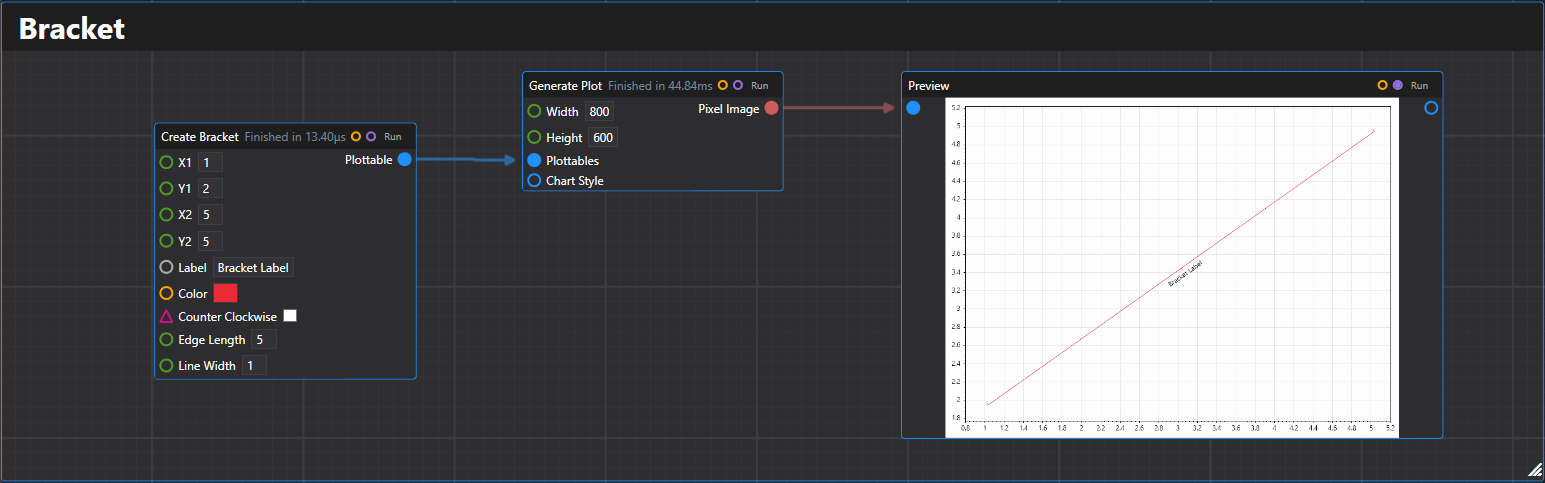
6. Bracket
Creates a bracket plottable between two points with optional labeling.
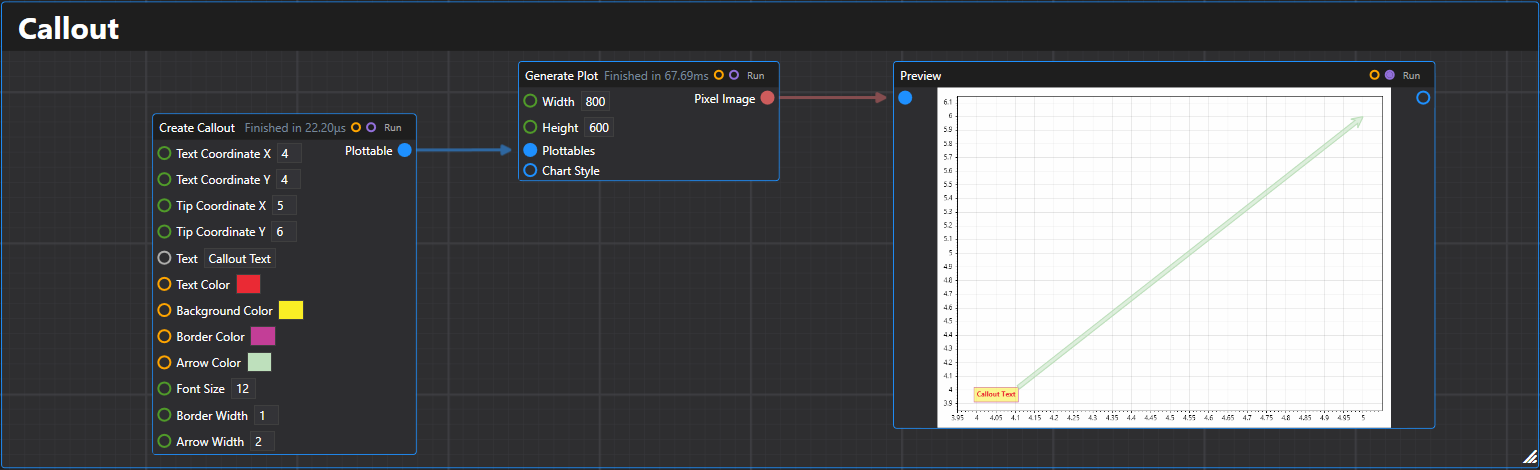
7. Callout
Creates a callout plottable with text and an arrow pointing to a specific location.
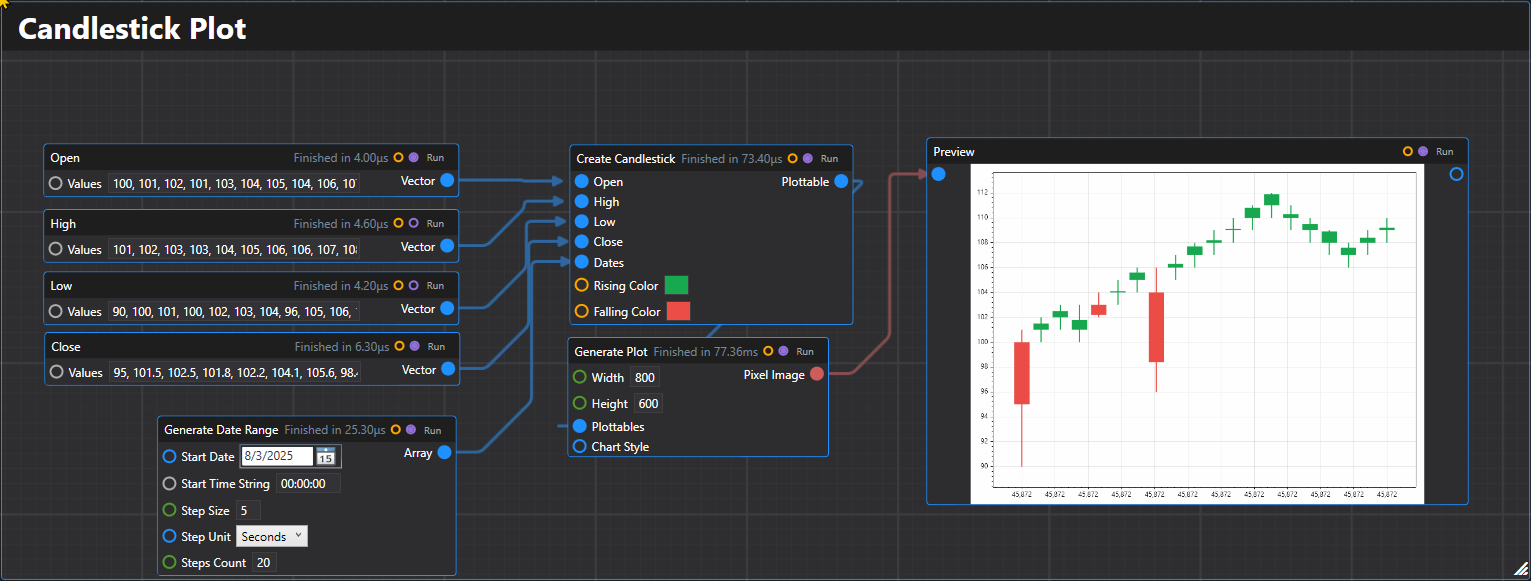
8. Candlestick
Creates a candlestick plot plottable from OHLC (Open-High-Low-Close) price data.
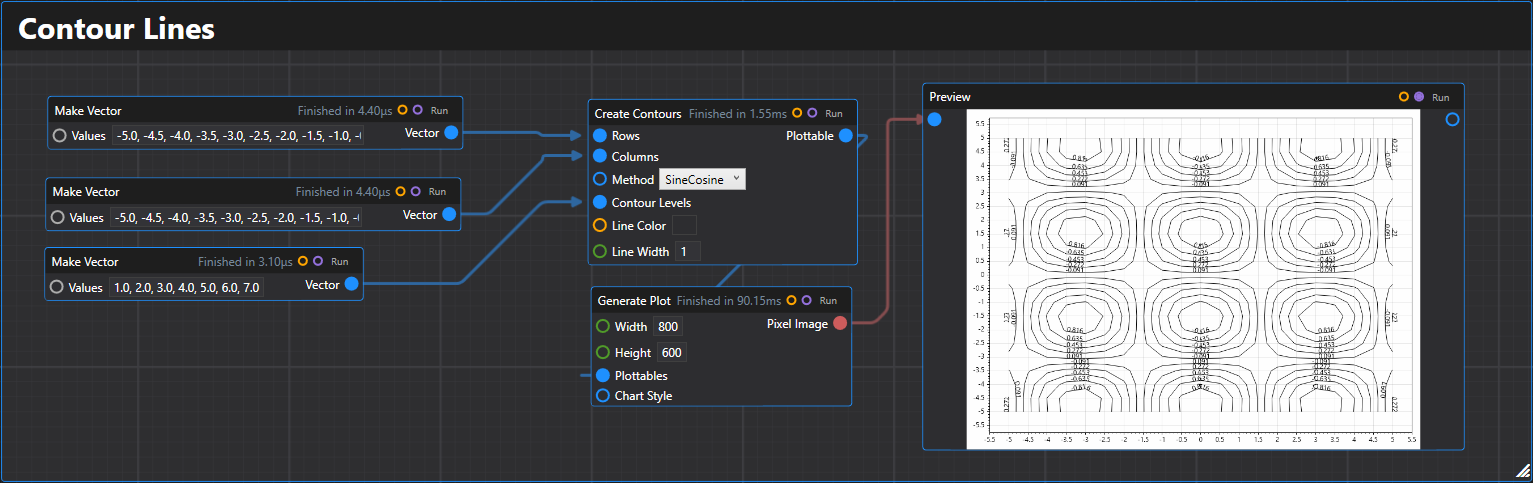
9. Contour Lines
Creates a contour lines plottable using two arrays to create a grid with a specified combination method.
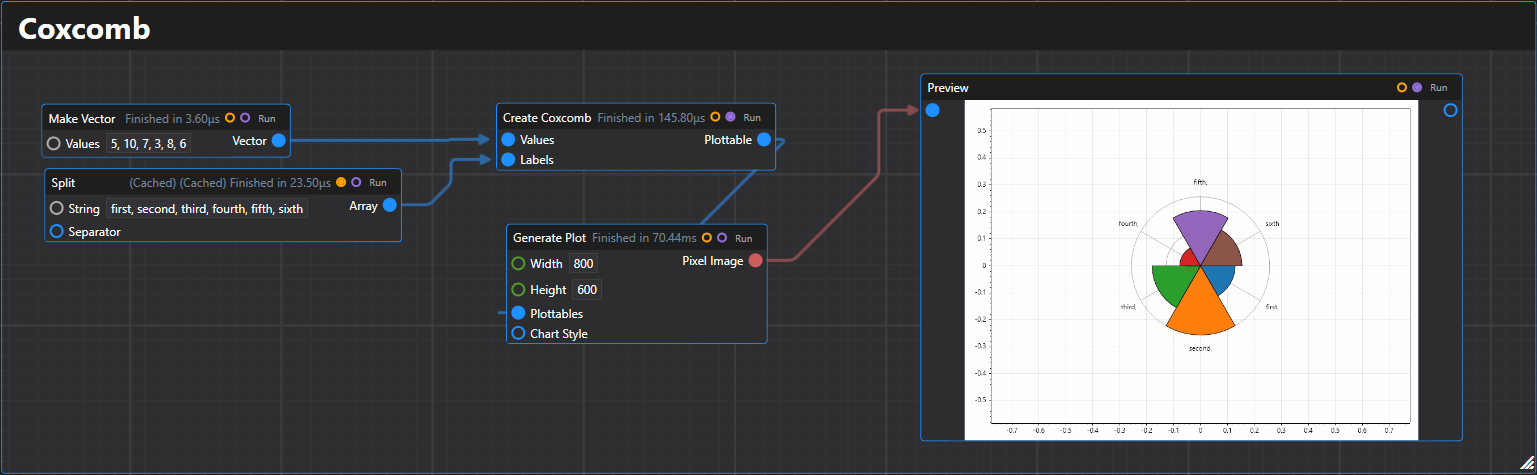
10. Coxcomb
Creates a coxcomb chart (polar bar chart) plottable from a list of values with optional labels.
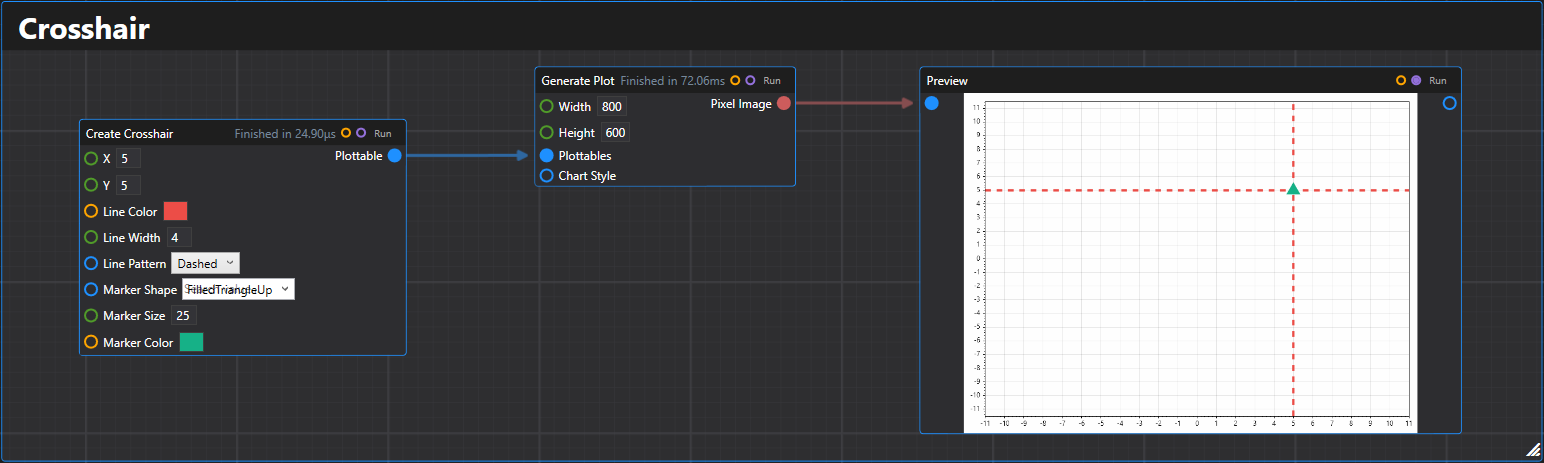
11. Crosshair
Creates a crosshair plottable at the specified coordinates with customizable styling.
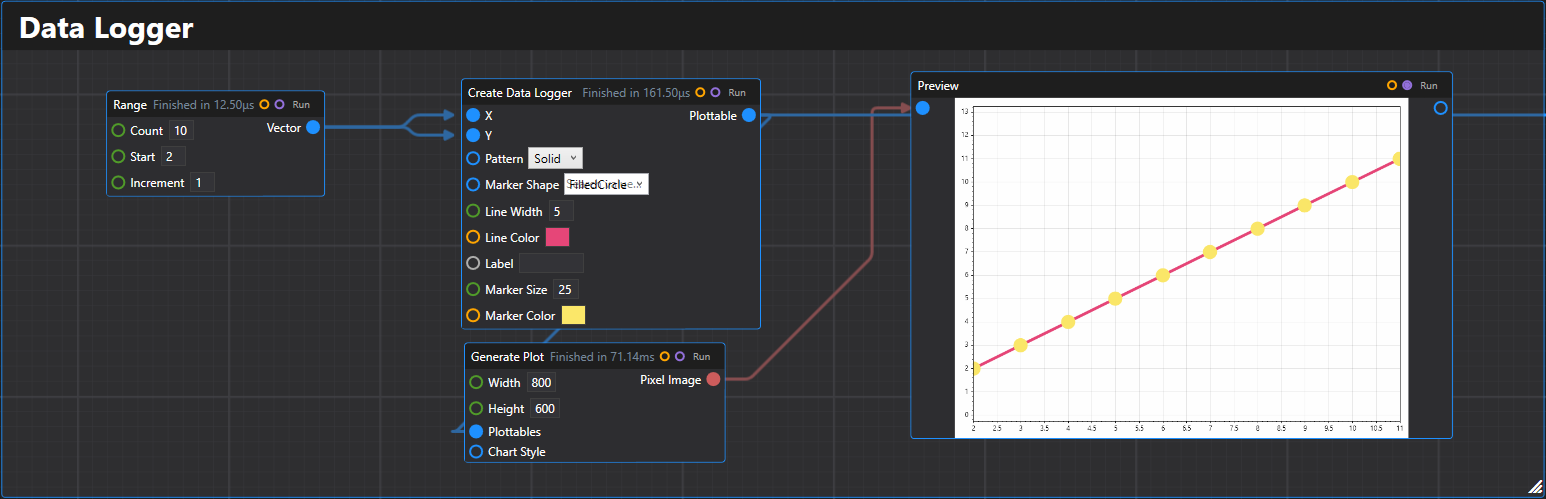
12. Data Logger
Creates a data logger plottable from arrays of x and y values with customizable styling.
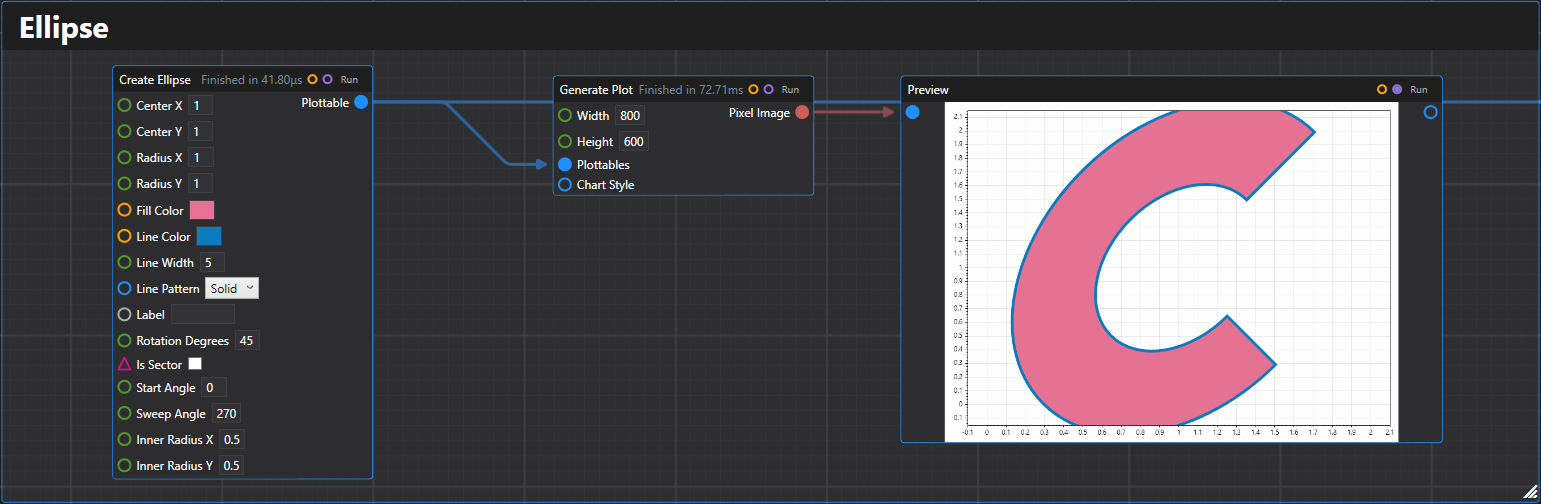
13. Ellipse
Creates an ellipse plottable with specified center, radii, and styling options.
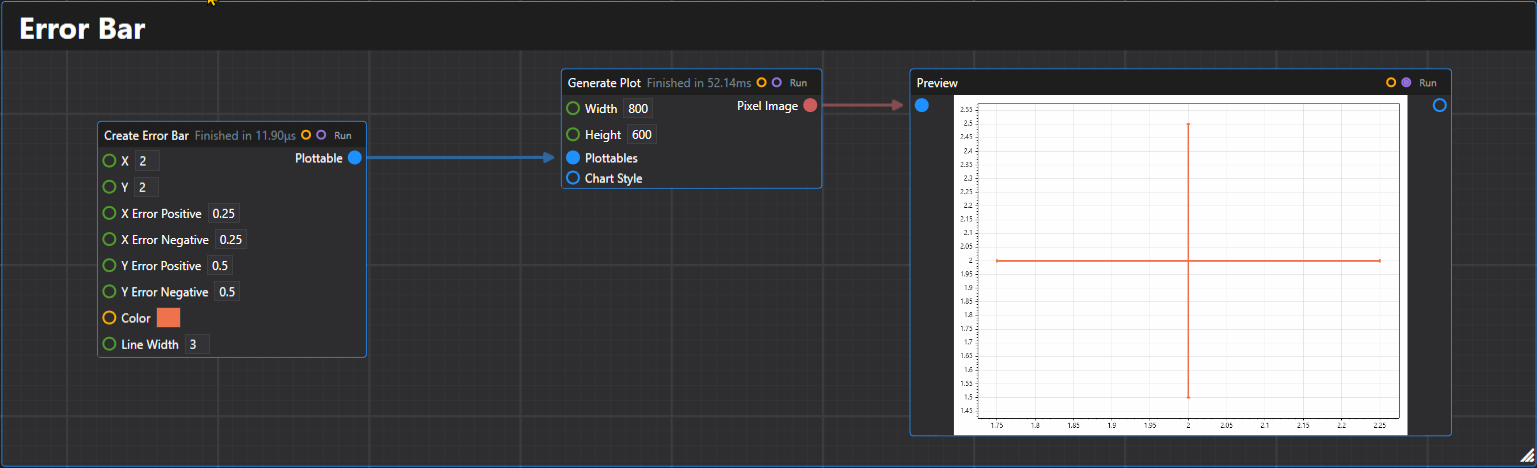
14. Error Bar
Creates a single error bar plottable with specified X, Y values and error ranges.
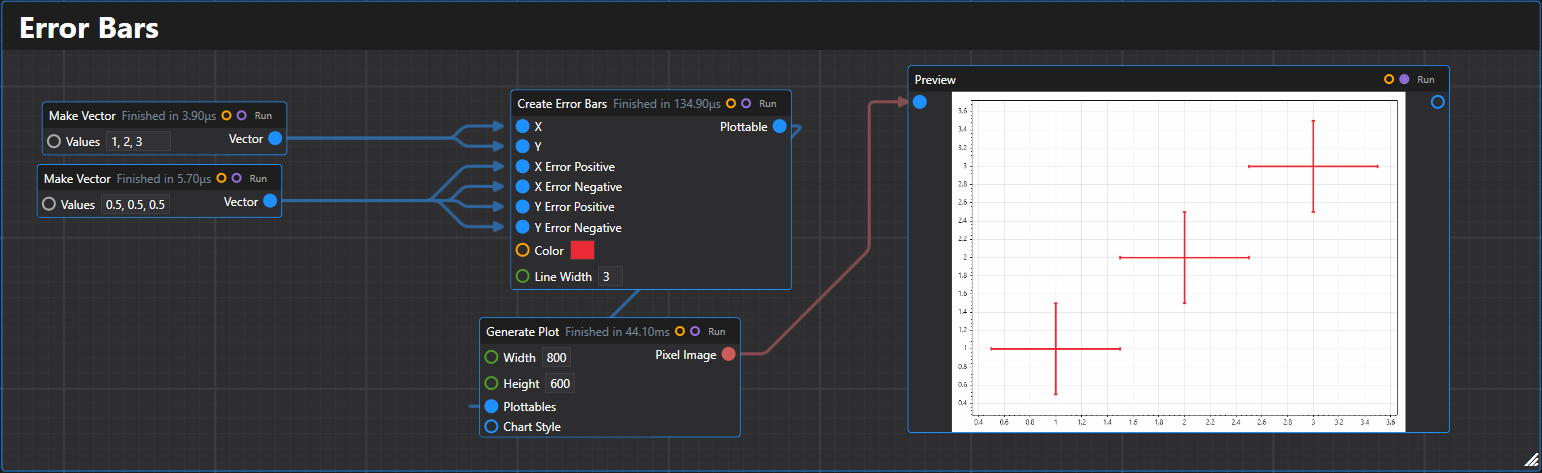
15. Error Bars
Creates multiple error bars plottable with optional X, Y error ranges.
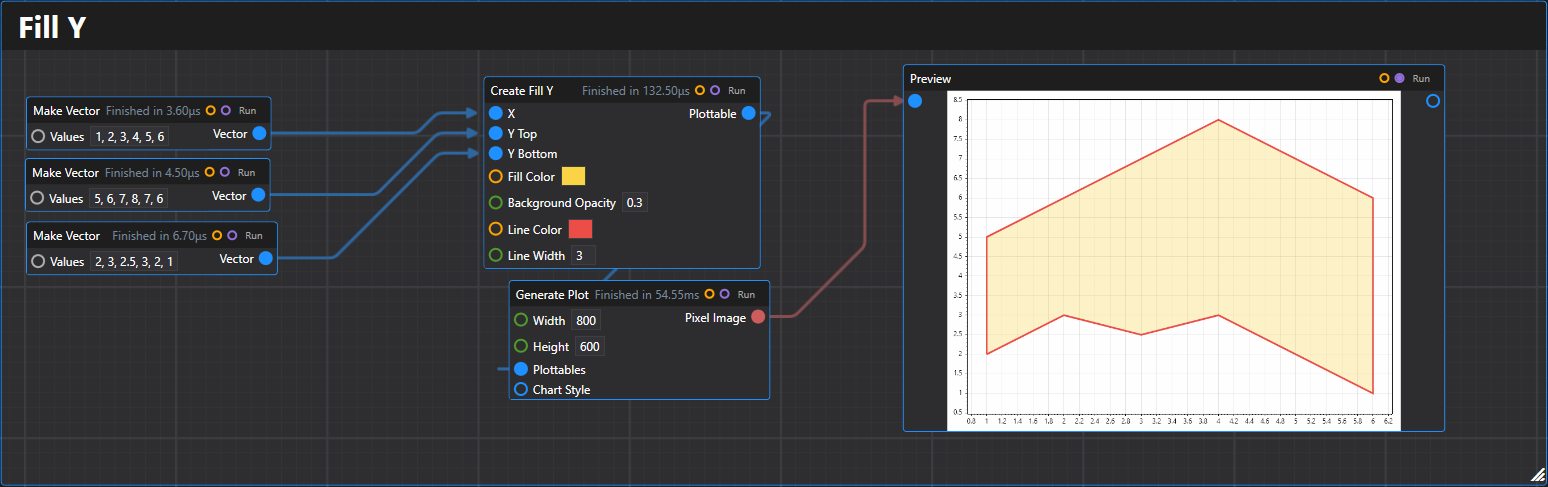
16. Fill Y
Creates a fill-between-Y-values plottable from arrays of x, top y, and bottom y values.
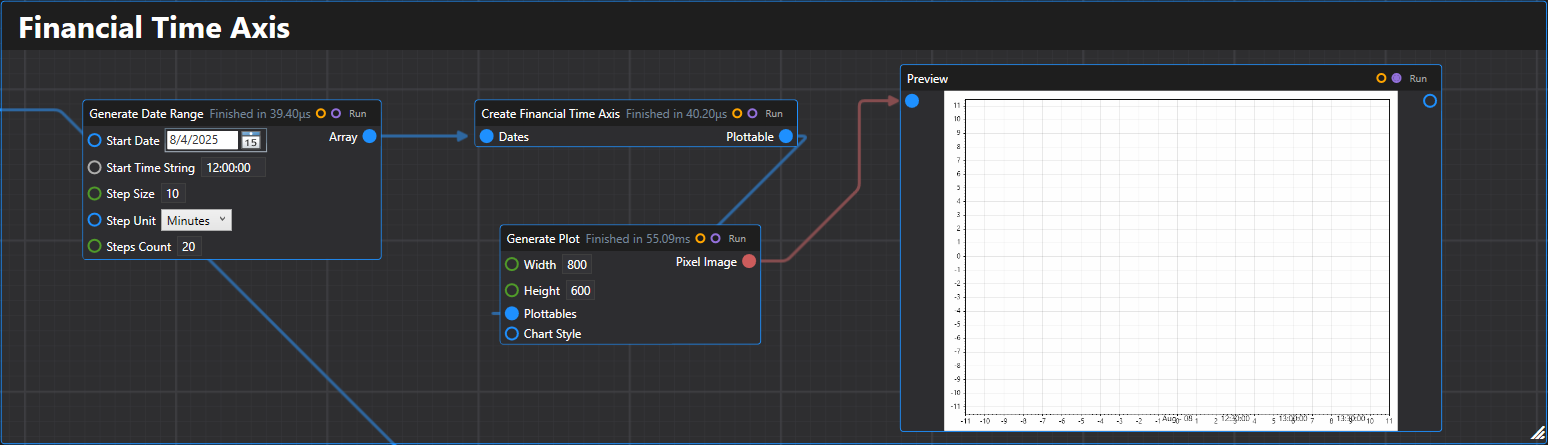
17. Financial Time Axis
Creates a financial time axis plottable for displaying sequential date data with proper spacing.
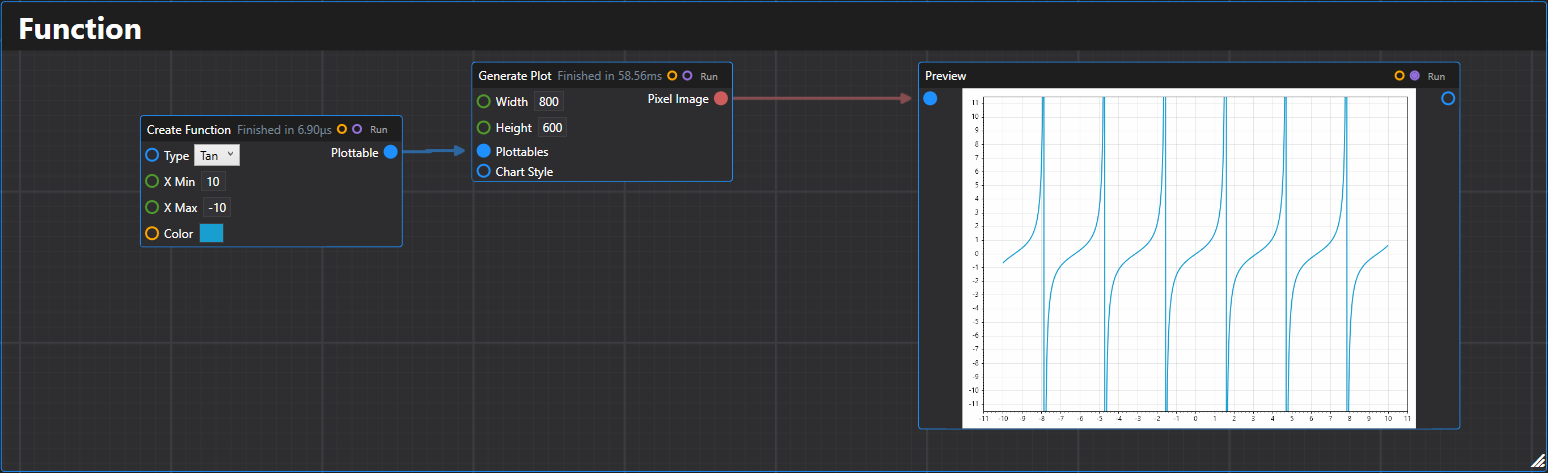
18. Function
Creates a mathematical function plottable over a specified range.
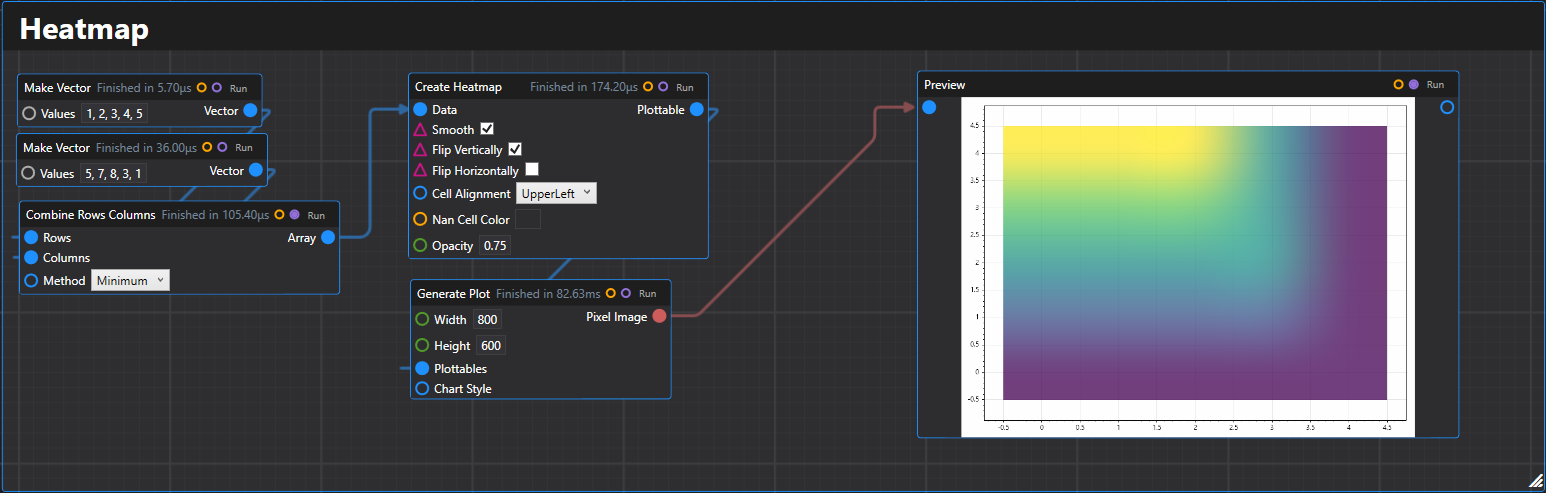
19. Heatmap
Creates a heatmap plottable from a 2D array of data values.
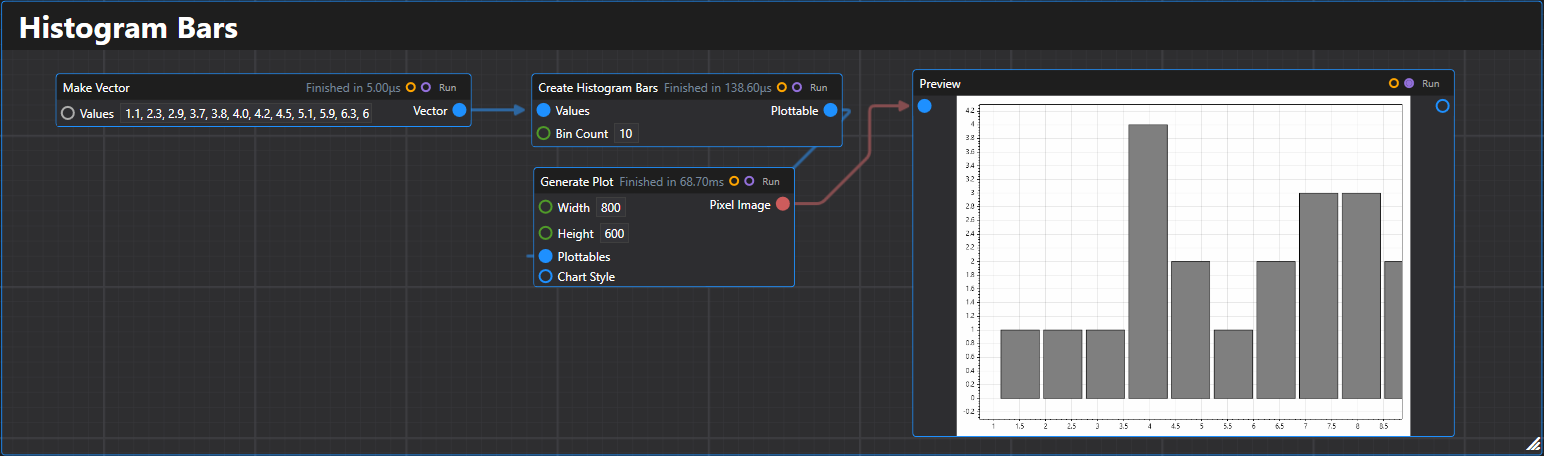
20. Histogram Bars
Creates a histogram bars plottable from an array of values with automatic binning.
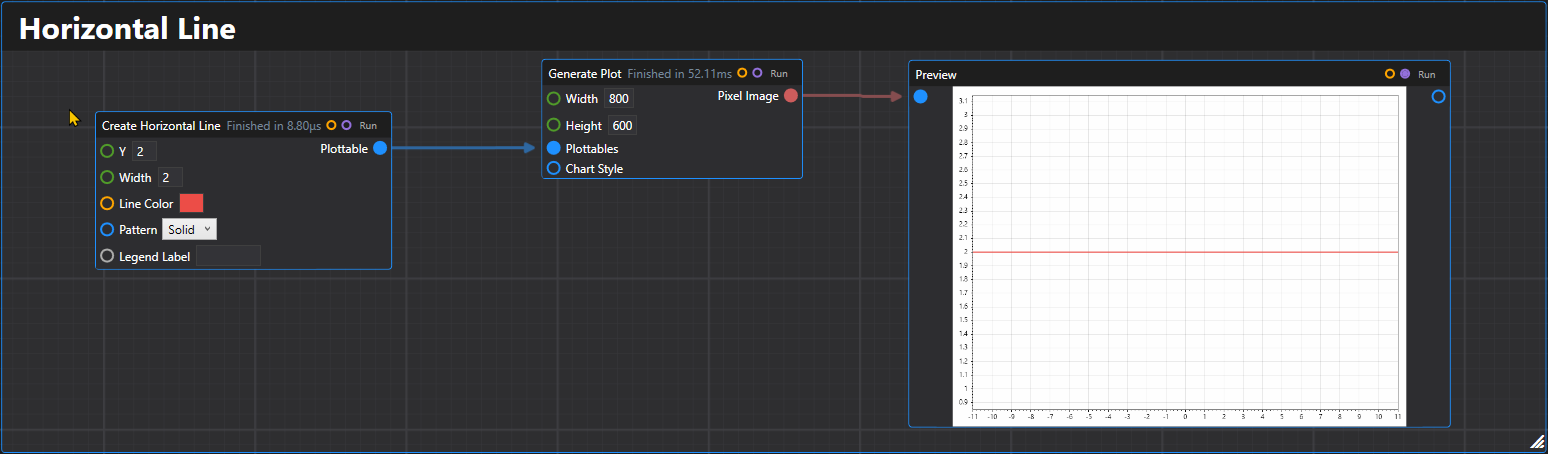
21. Horizontal Line
Creates a horizontal line plottable at the specified Y coordinate.
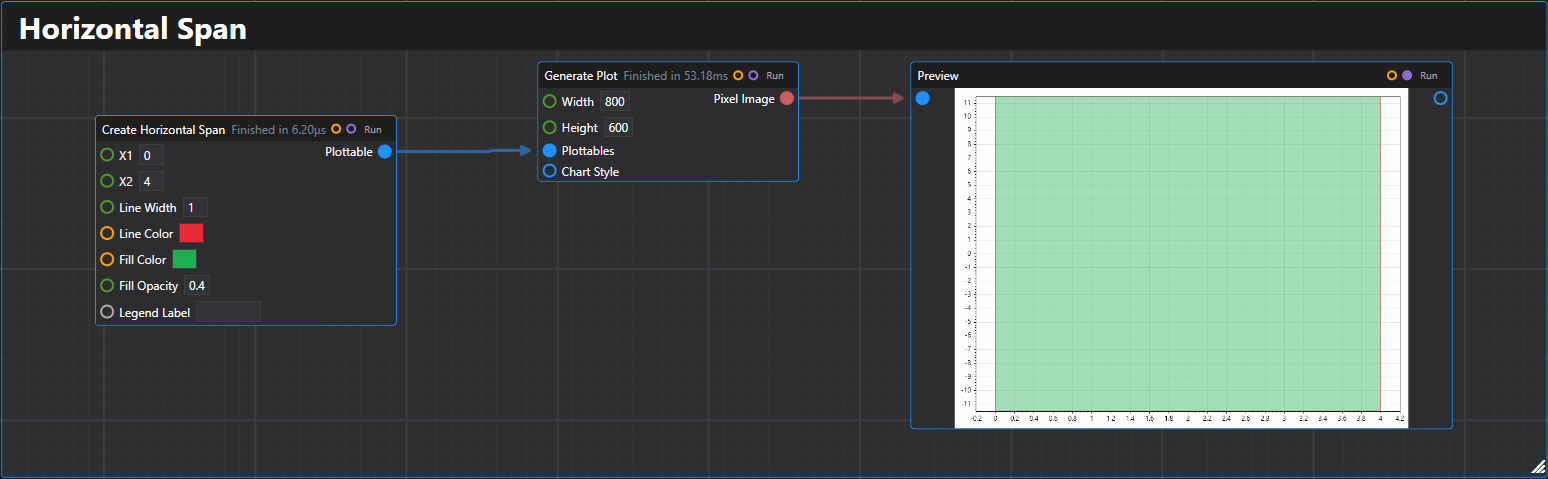
22. Horizontal Span
Creates a horizontal span plottable between two X coordinates.
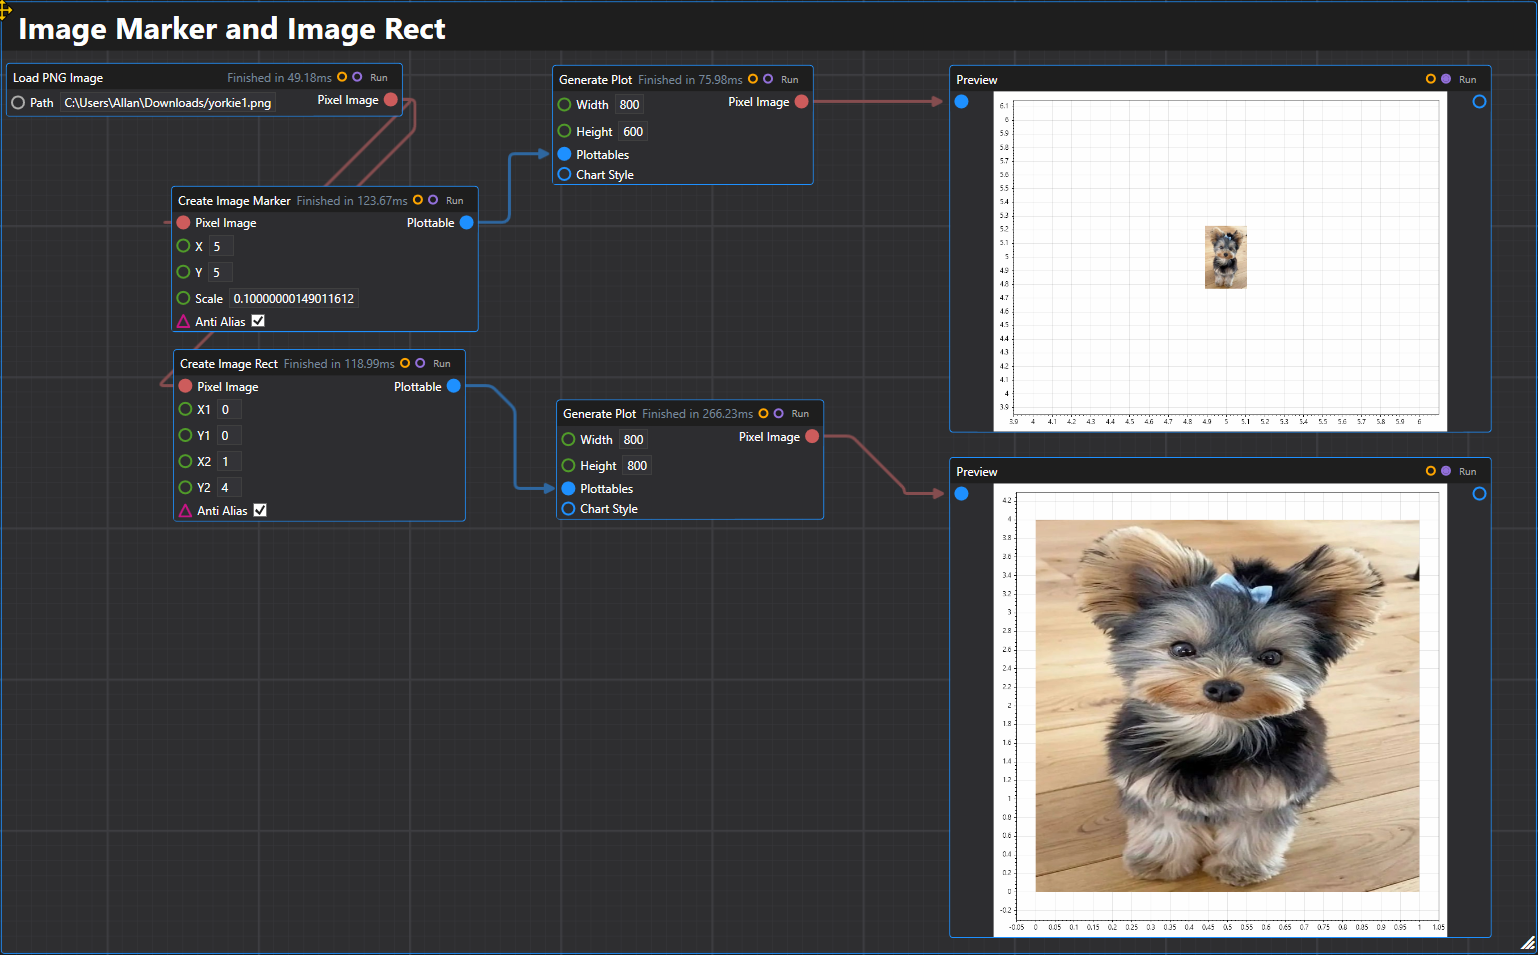
23. Image Marker & Image Rect
Creates image plottables that display images at specific coordinates or within rectangles.
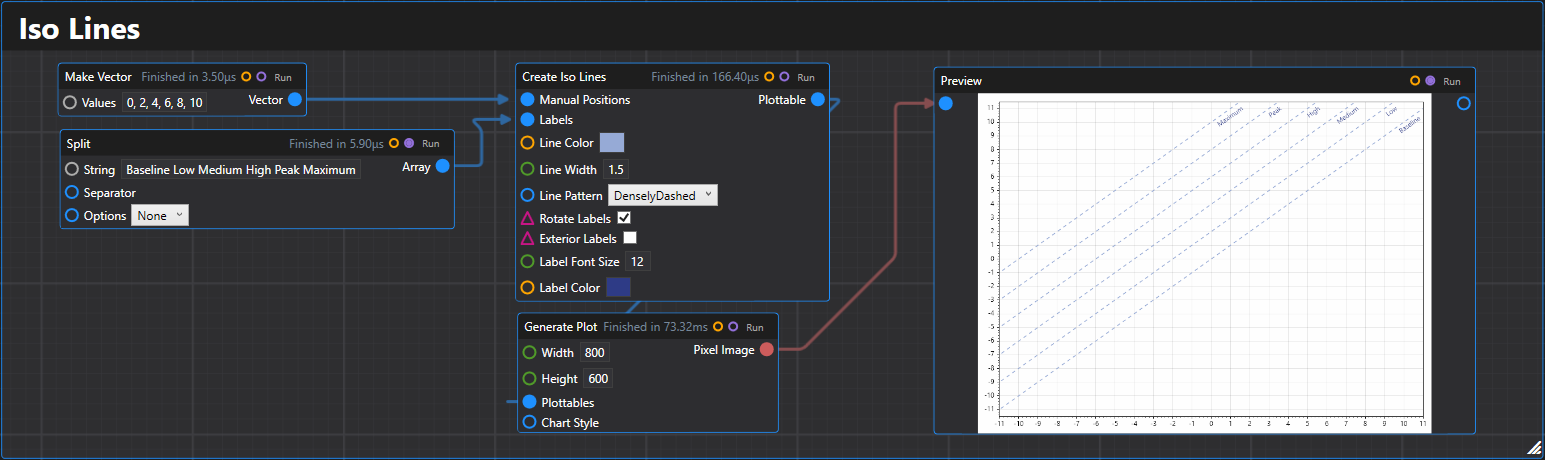
24. Iso Lines
Creates isolines (diagonal reference lines) plottable with customizable positioning and appearance.
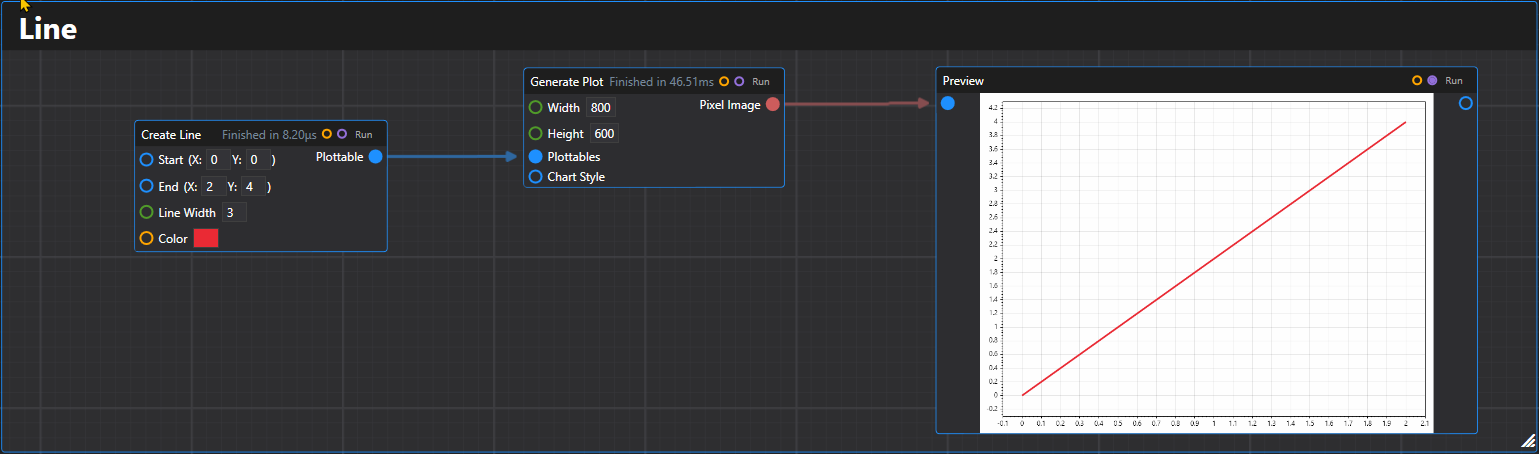
25. Line
Creates a line plottable between two Vector2D points.
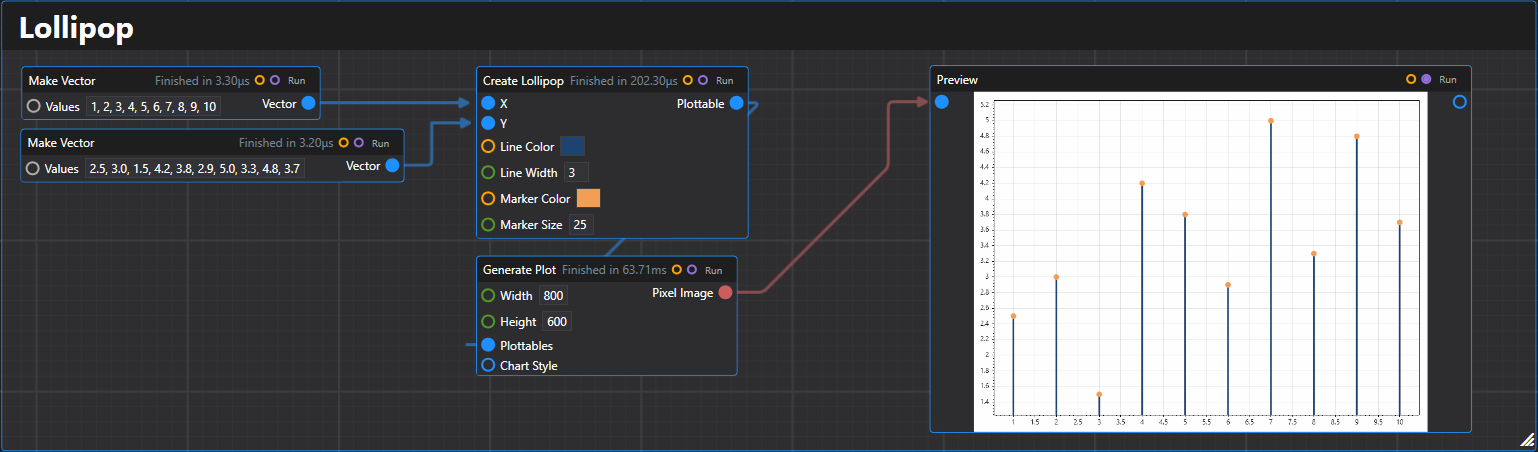
26. Lollipop
Creates a lollipop plot plottable from arrays of x and y values.
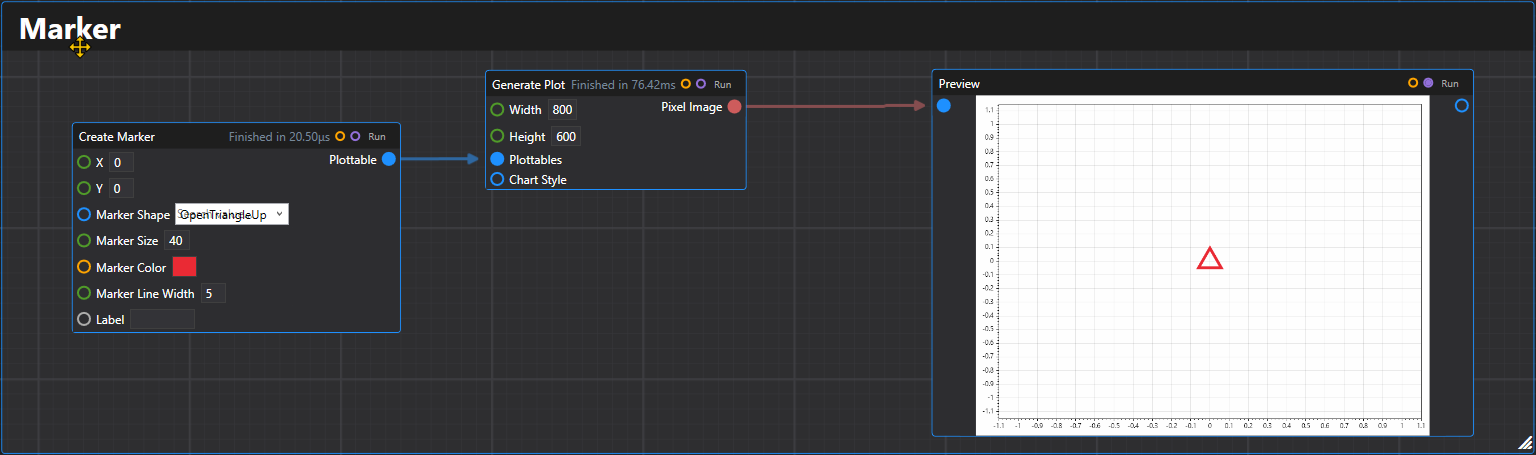
27. Marker
Creates a single marker plottable at the specified coordinates.
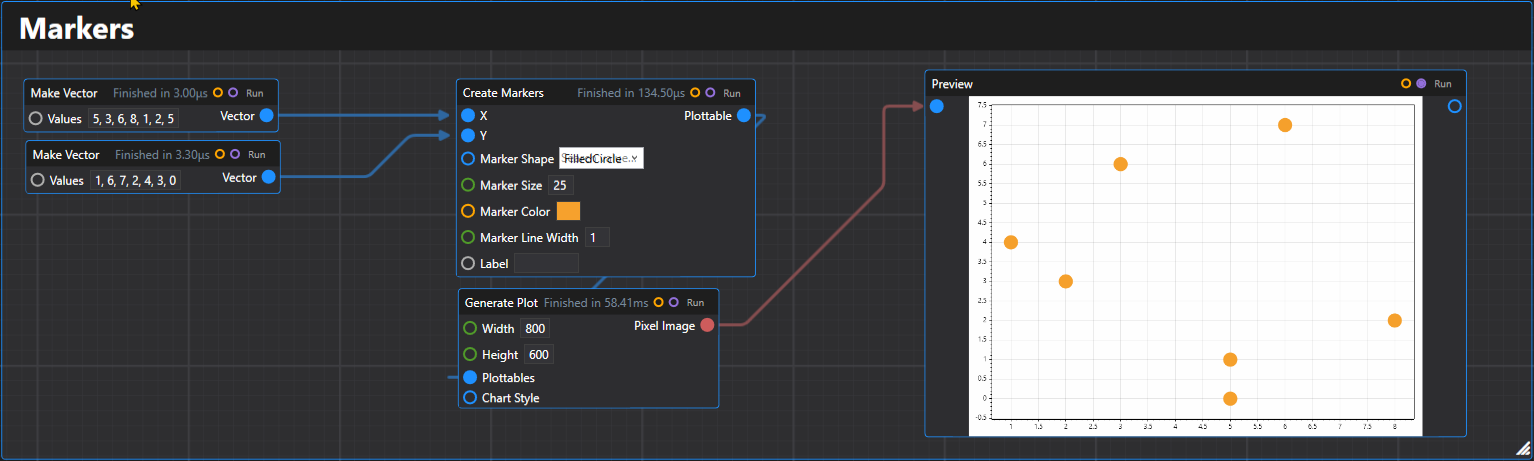
28. Markers
Creates multiple markers plottable from arrays of x and y coordinates.
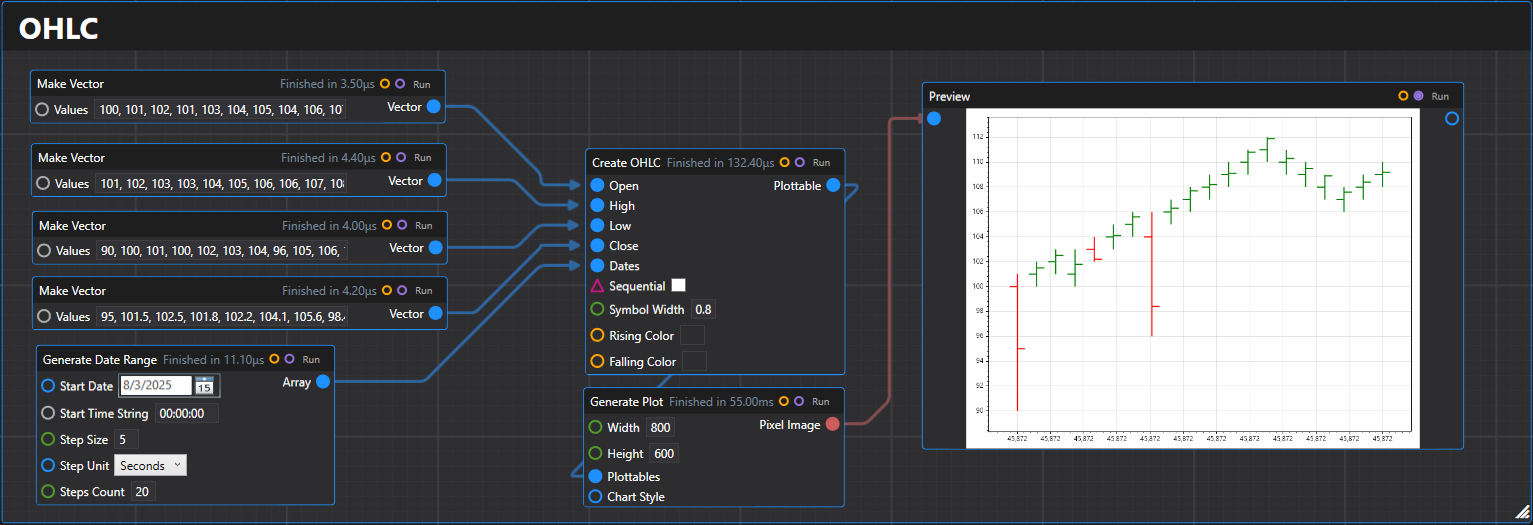
29. OHLC
Creates an OHLC (Open-High-Low-Close) plottable from arrays of price data.
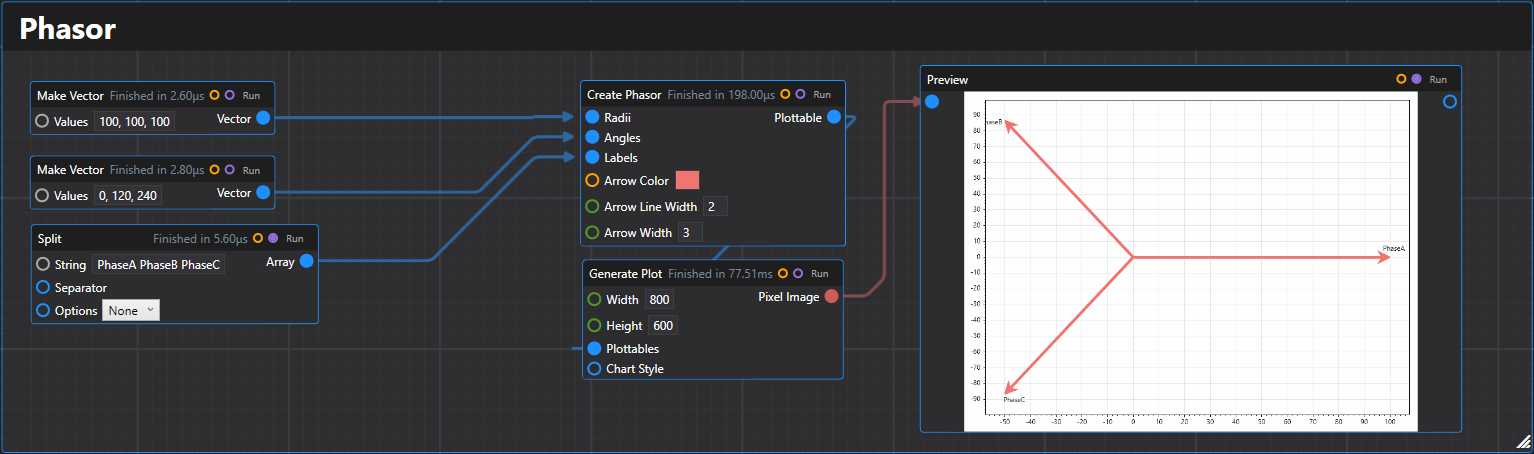
30. Phasor
Creates a phasor plottable that displays arrows from the origin to points in polar coordinates.
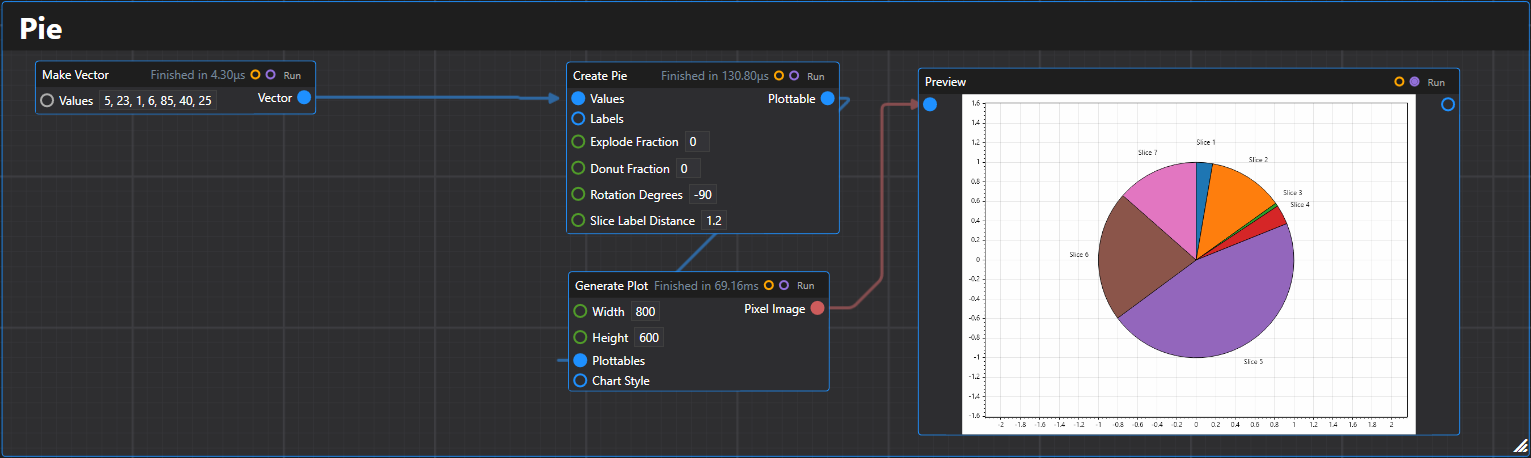
31. Pie
Creates a pie chart plottable from a list of values with optional labels.
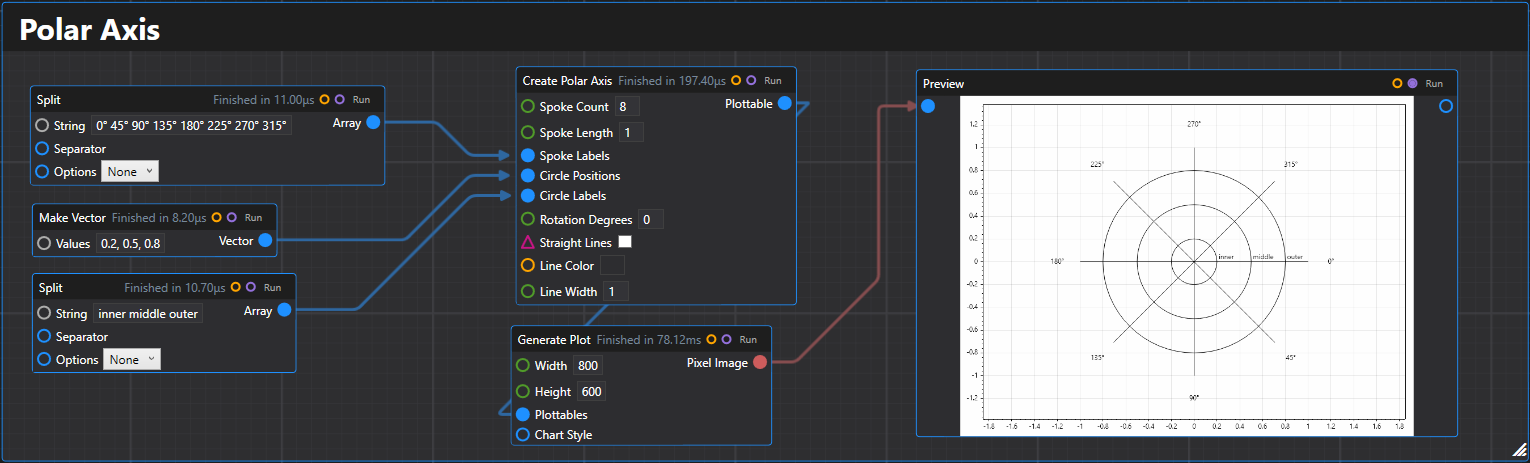
32. Polar Axis
Creates a polar axis plottable with customizable spokes and circles for polar coordinate plotting.
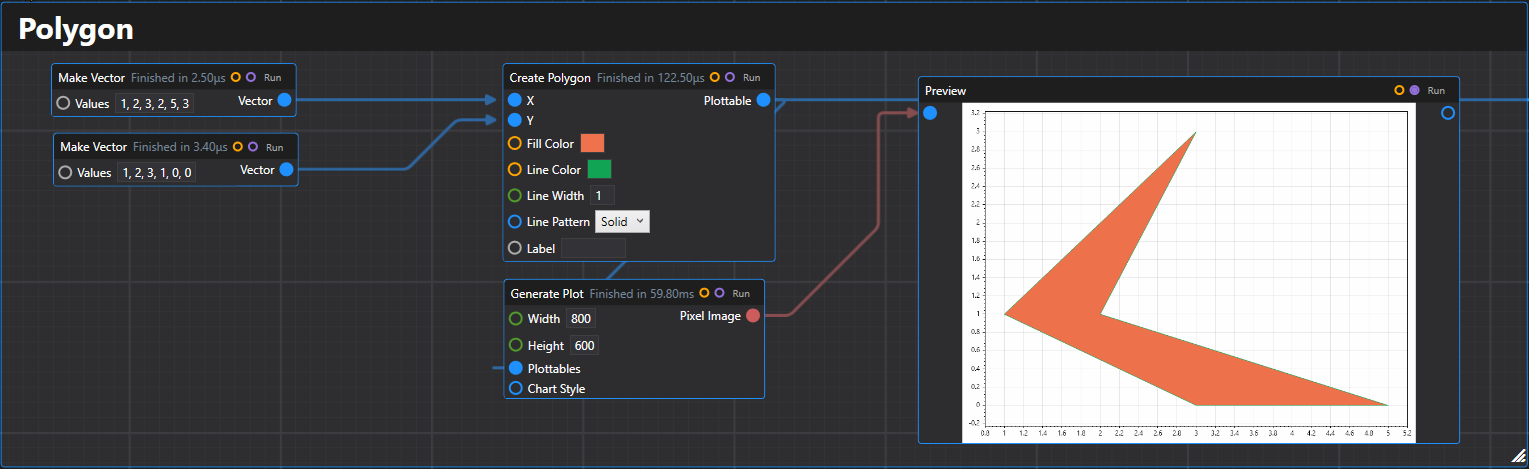
33. Polygon
Creates a polygon plottable from arrays of x and y coordinates.
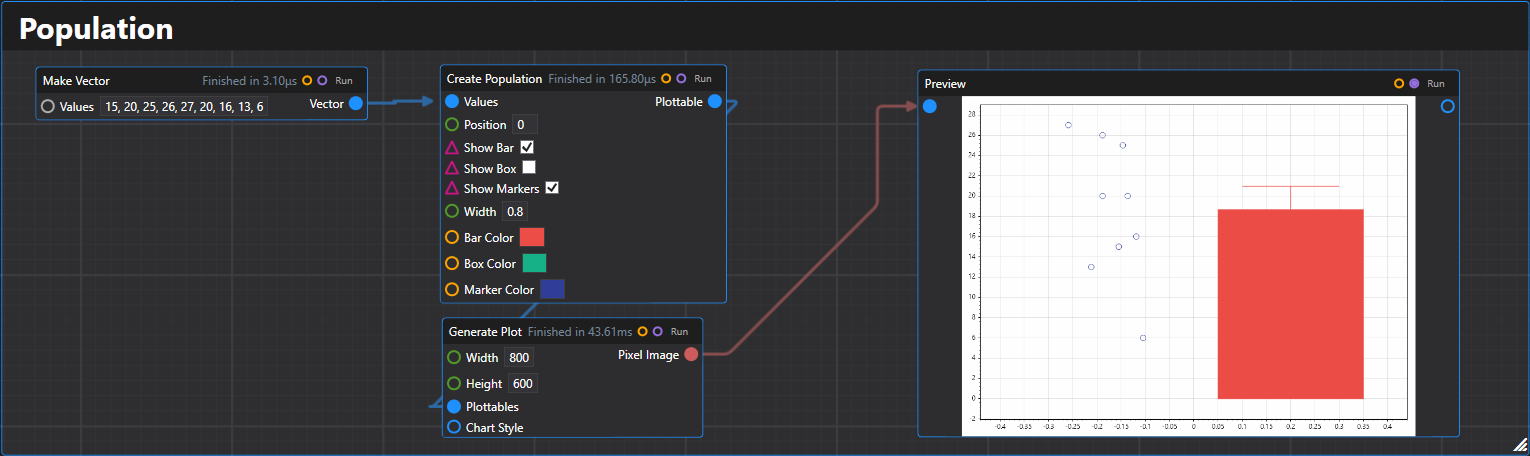
34. Population
Creates a population plot plottable showing the distribution of data points with optional statistical displays.
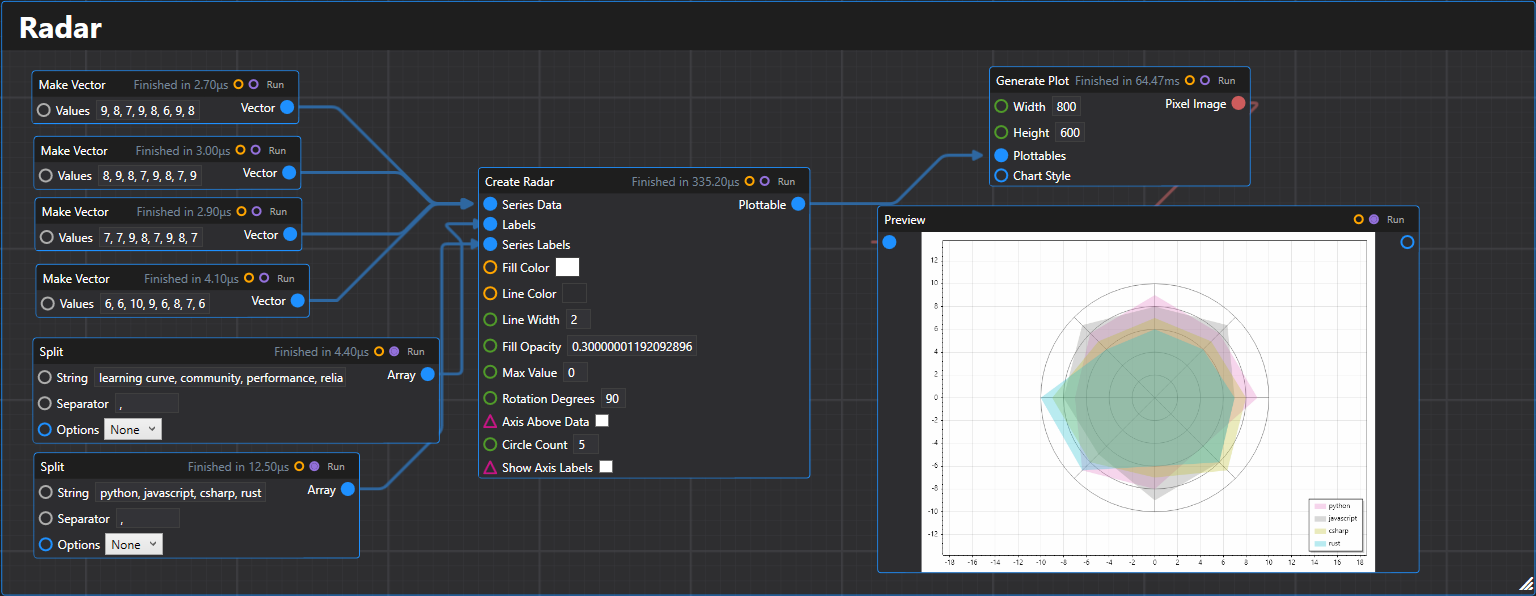
35. Radar
Creates a radar chart plottable with multiple series displaying values on polar axes.
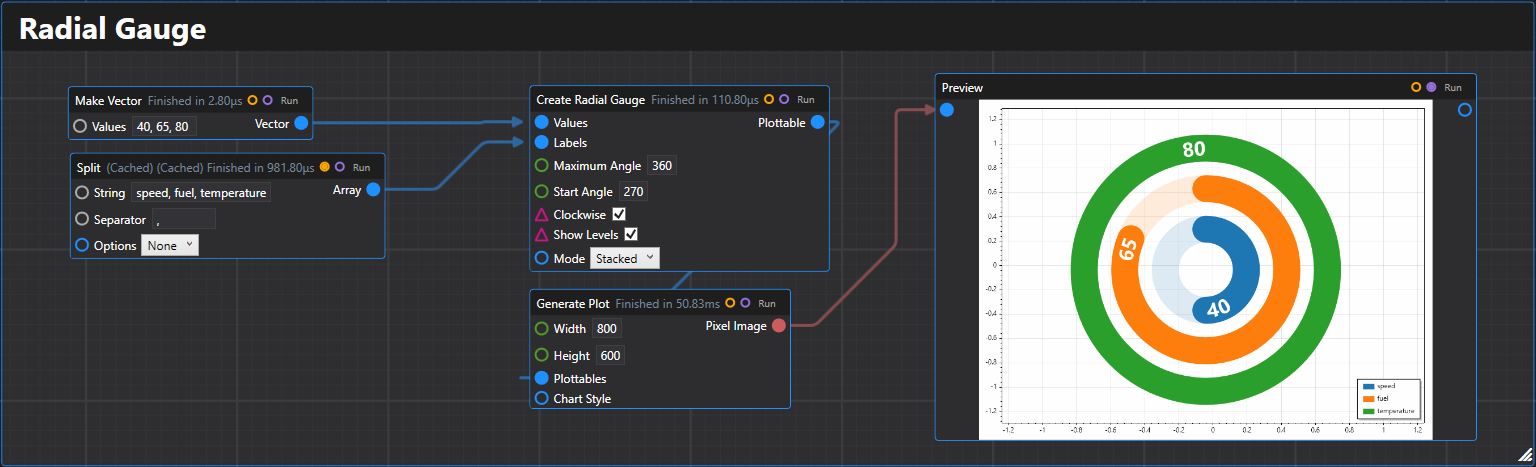
36. Radial Gauge
Creates a radial gauge chart with multiple gauges representing scalar values.
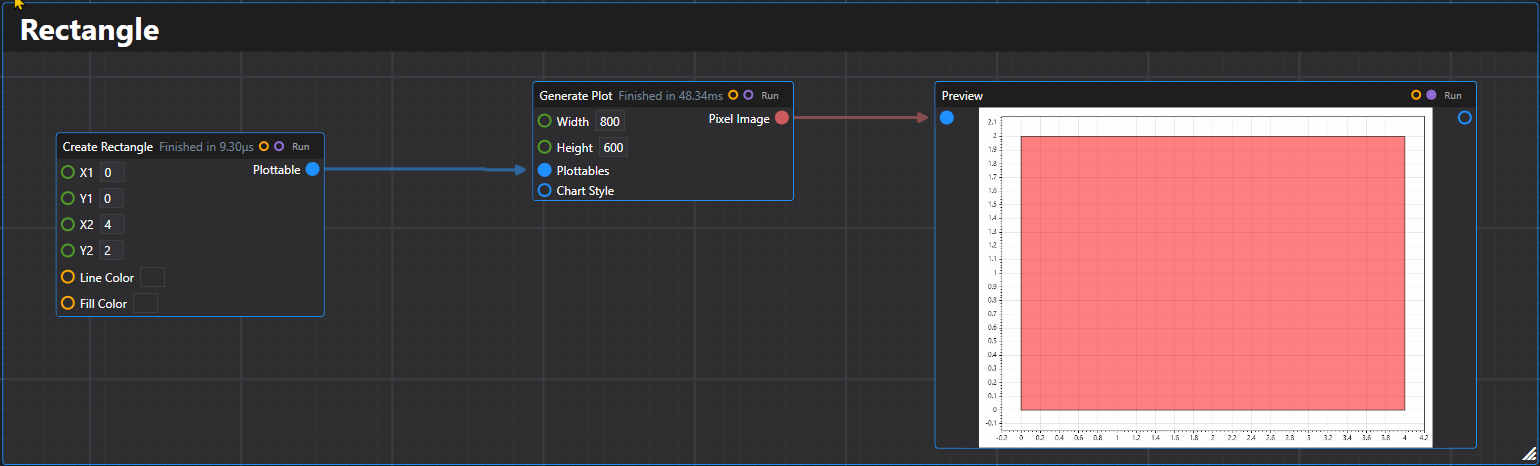
37. Rectangle
Creates a rectangle plottable with specified coordinates and styling.
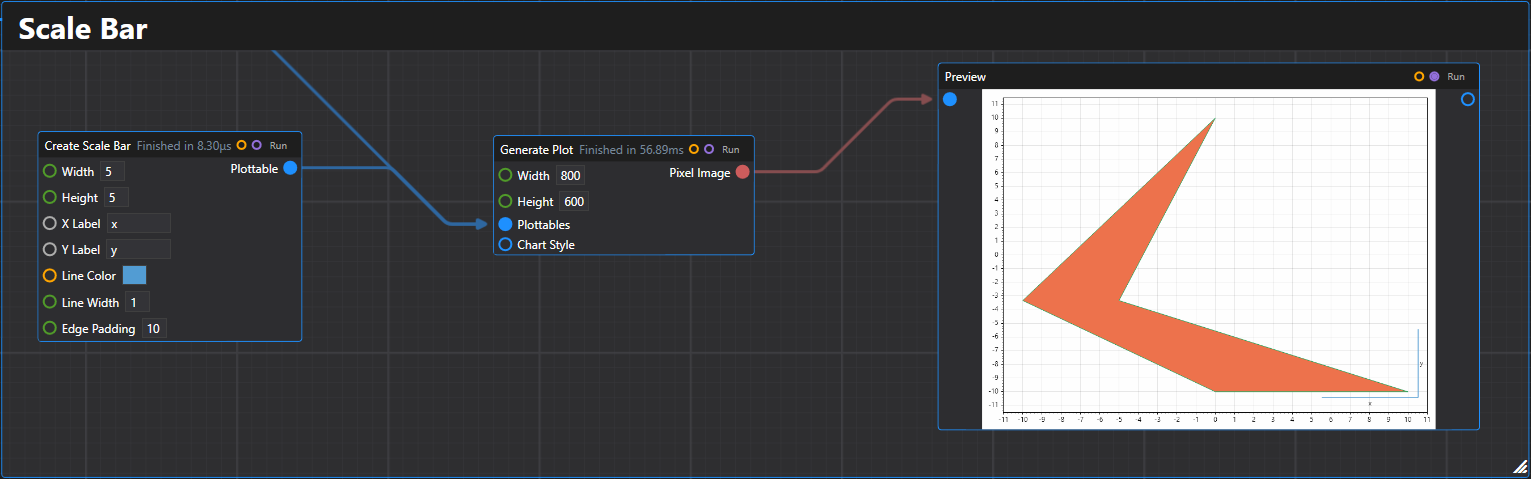
38. Scale Bar
Creates a scale bar plottable for indicating measurement scales on plots.
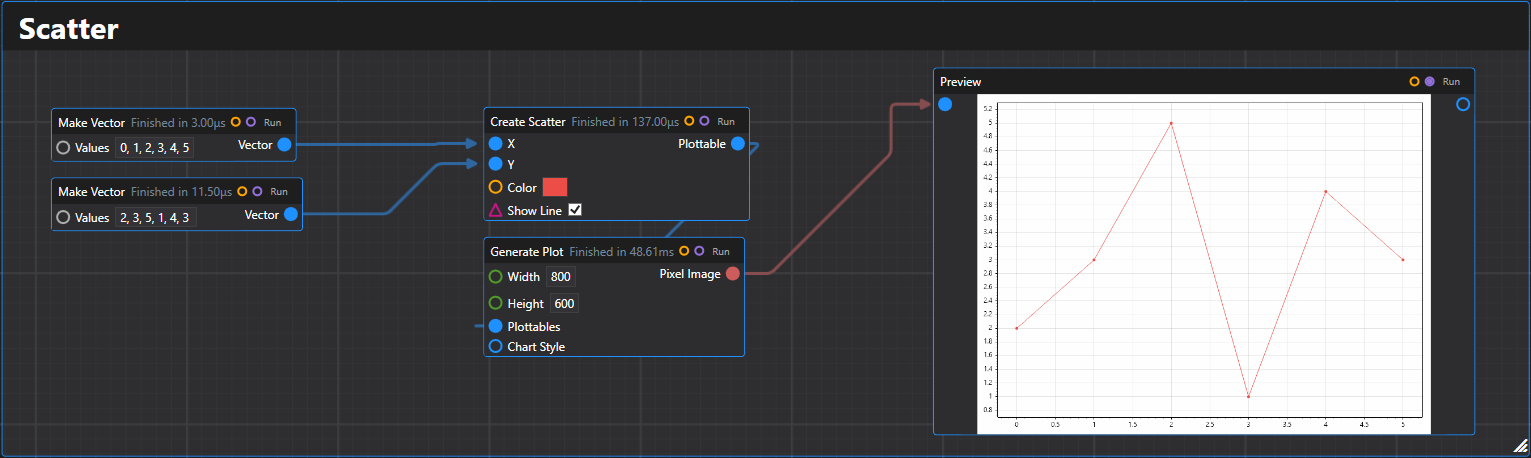
39. Scatter
Creates a scatter plot plottable from arrays of x and y values.
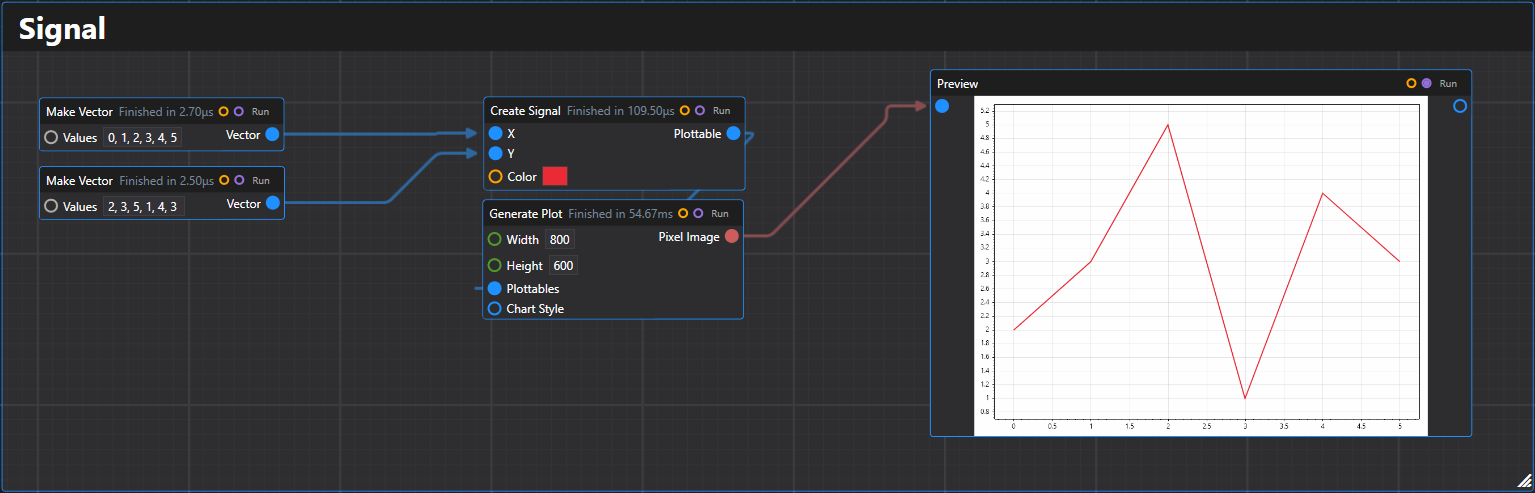
40. Signal
Creates a fast-rendering time series signal plottable from arrays of x and y values.
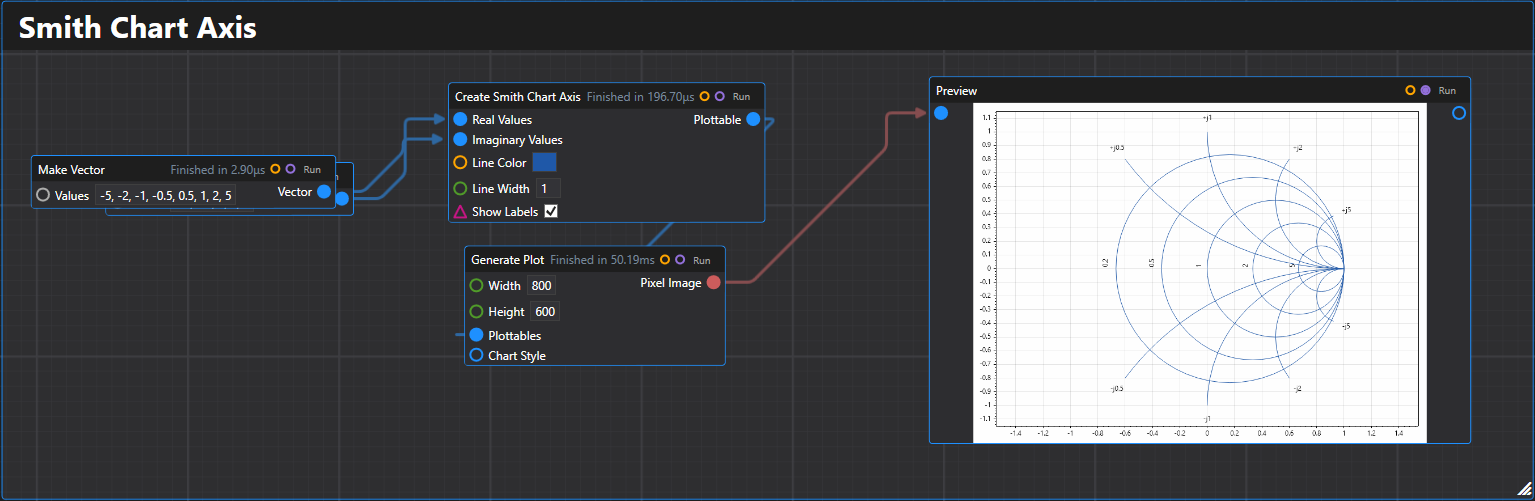
41. Smith Chart Axis
Creates a Smith chart axis plottable for RF and microwave engineering applications.
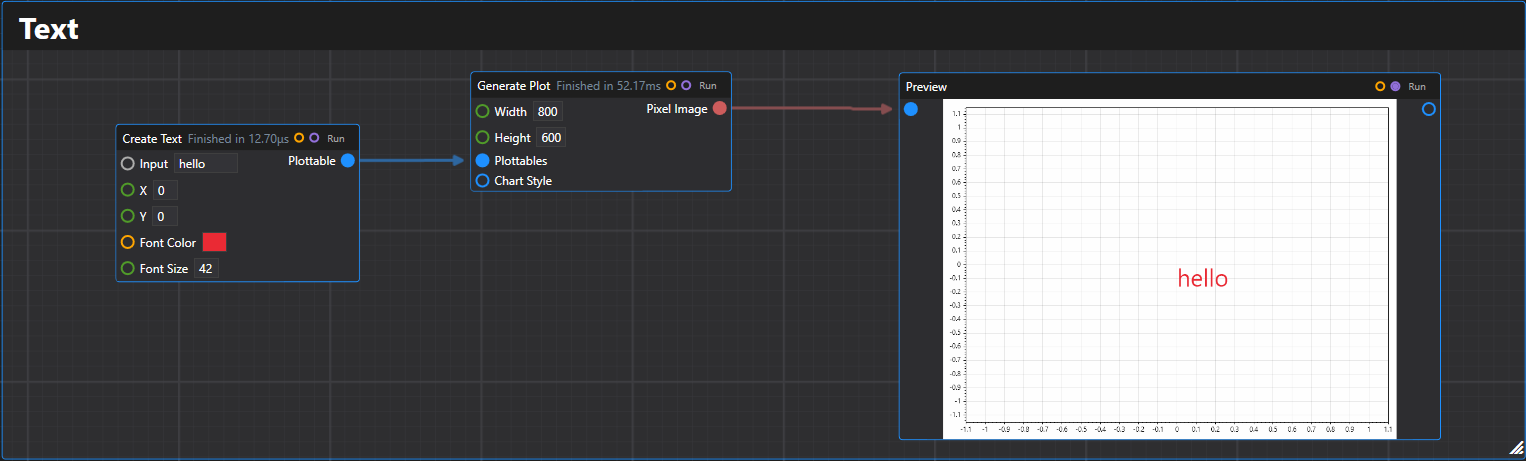
42. Text
Creates a text label plottable at the specified coordinates.
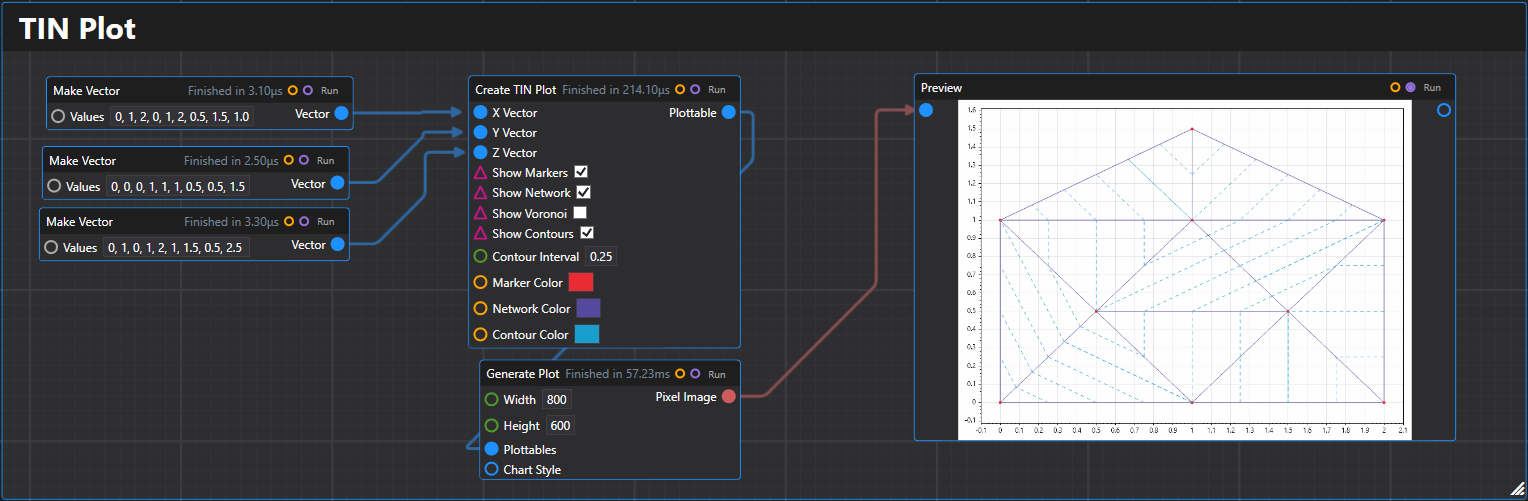
43. TIN Plot
Creates a TIN (Triangulated Irregular Network) plottable for 3D surface representation.
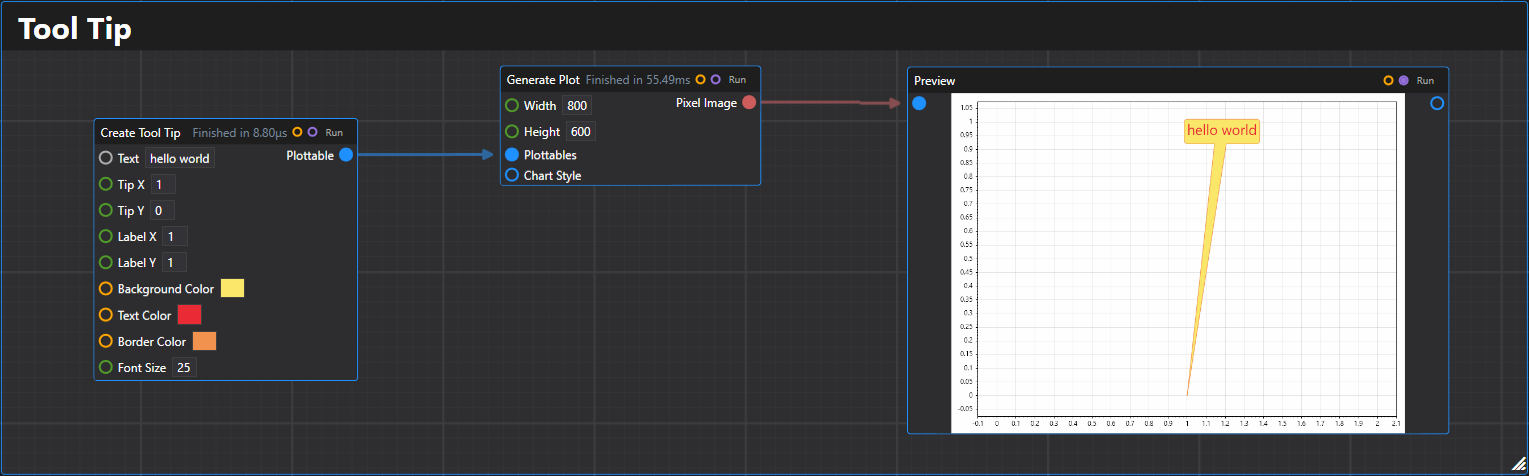
44. Tooltip
Creates a tooltip plottable that displays text with an arrow pointing to a specific location.
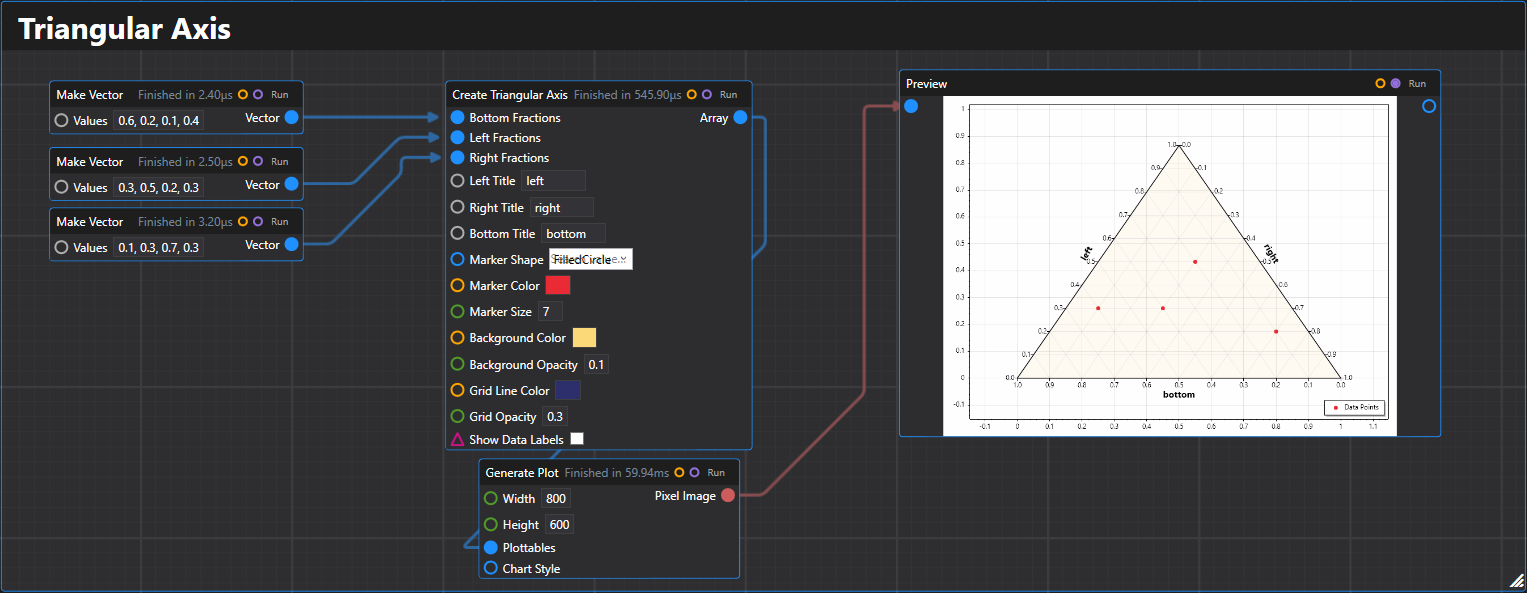
45. Triangular Axis
Creates a triangular axis for ternary plots with data points and customizable styling.
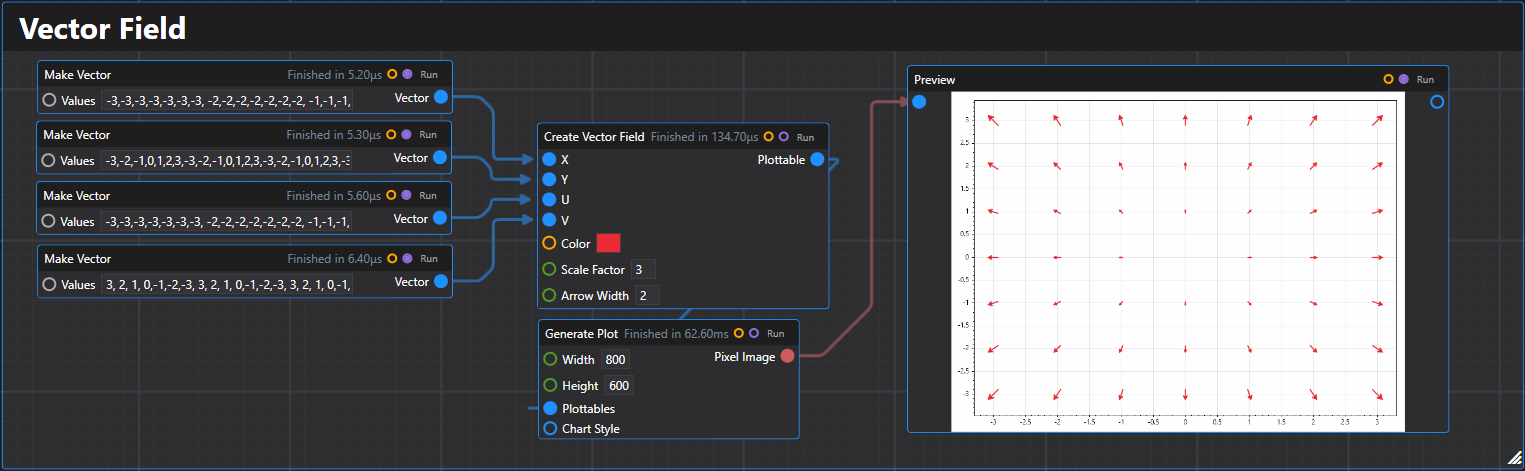
46. Vector Field
Creates a vector field plot displaying arrows at specified points with given vector components.
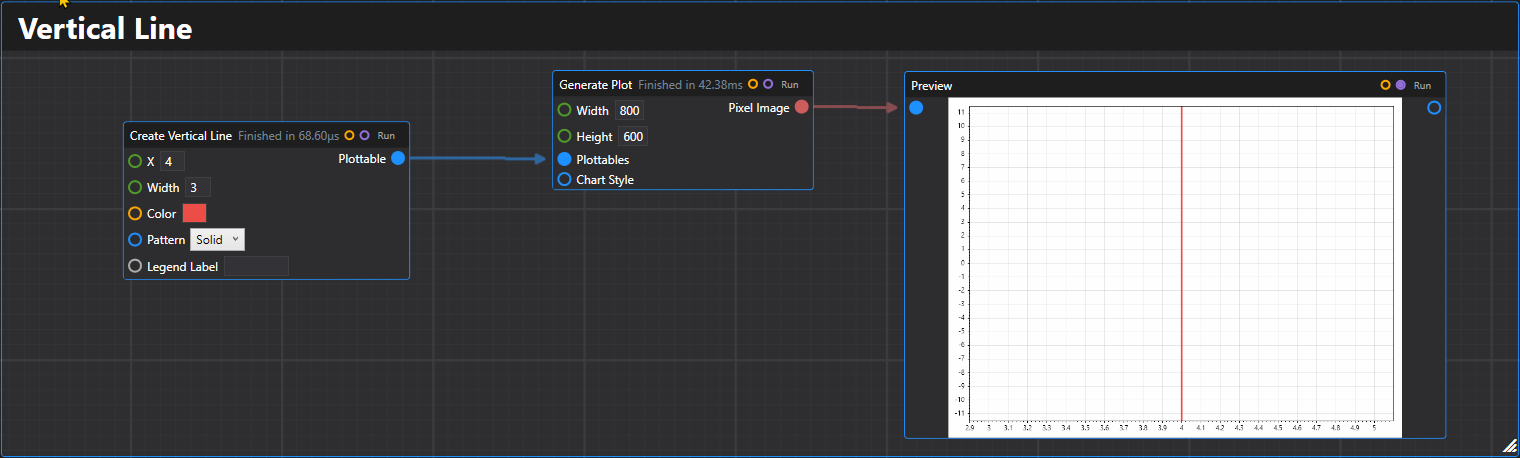
47. Vertical Line
Creates a vertical line plottable at the specified X coordinate.
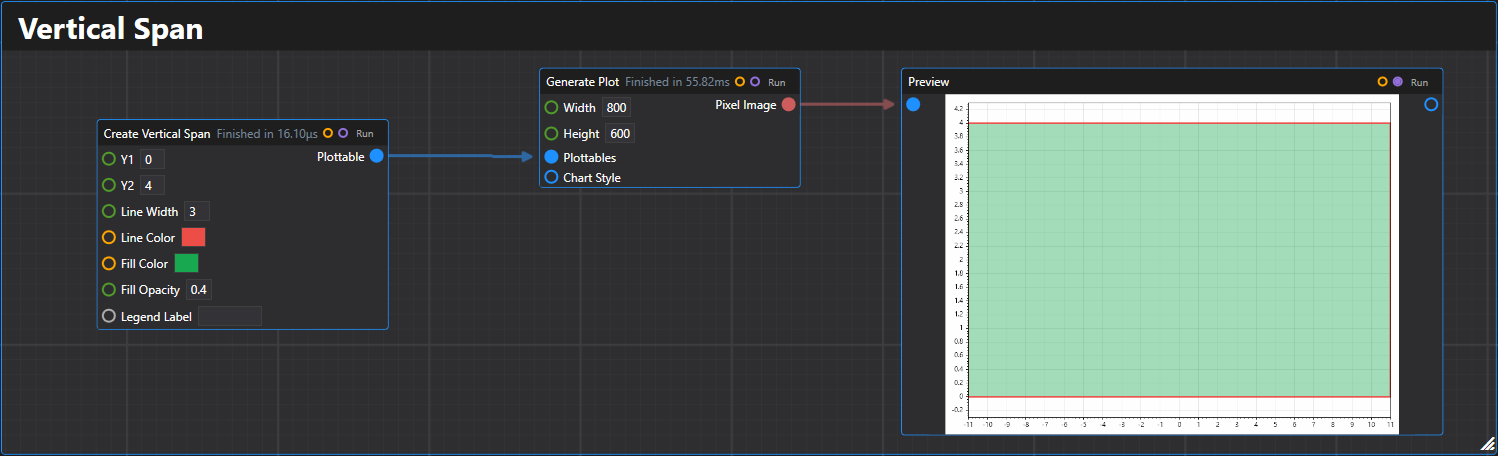
48. Vertical Span
Creates a vertical span plottable between two Y coordinates.
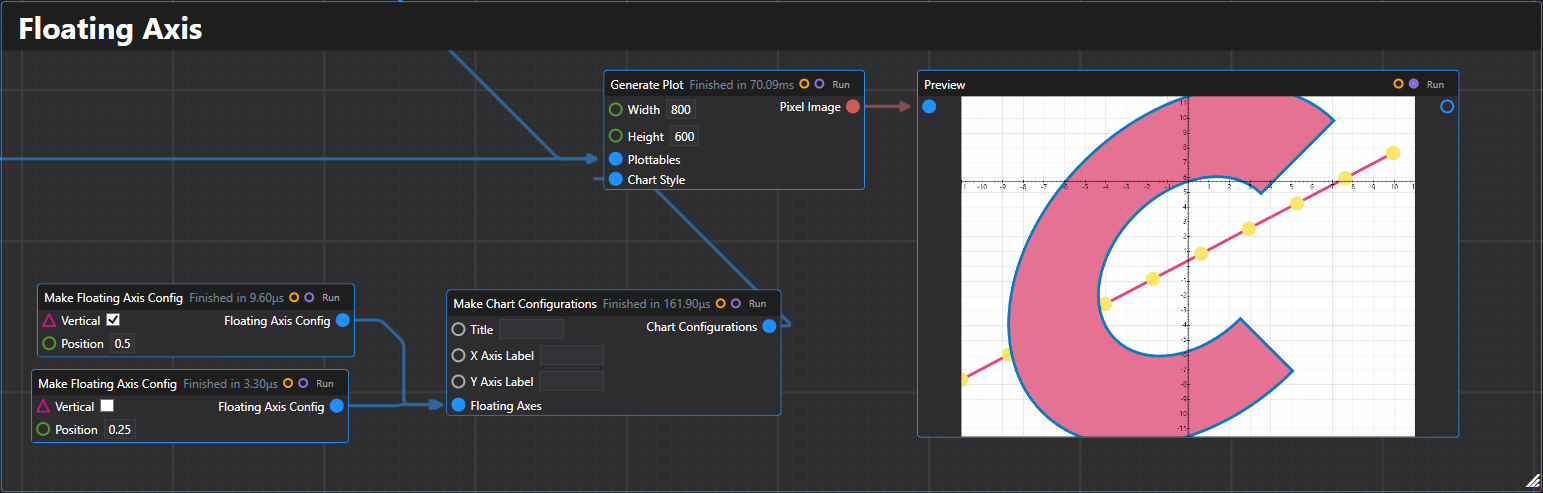
Supported Configuration Elements:
- Plot title -
WithTitle(string title) - X Axis Label -
WithXAxis(string xAxisLabel) - Y Axis Label -
WithYAxis(string yAxisLabel) - Floating Axes - Support for custom positioned axes
3. Specialized Plots
Those are typically exposed through QuickPlot as well.
- QR Code
- Population Pyramid
- And more!
4. Dhole
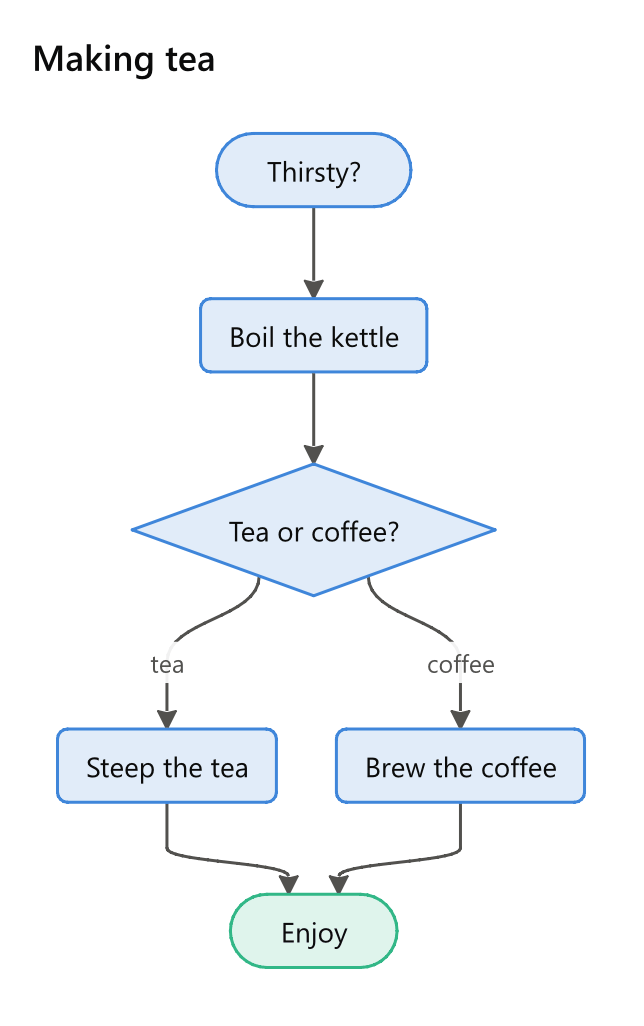
Dhole draws charts and diagrams from text: the first line names what to draw, and the lines after say what it shows. Its nodes are in the Plotting toolbox's Dhole category - Draw Dhole, Describe Dhole and Write Dhole - and what Draw Dhole gives is a chart like any other here, so it previews, takes a theme, and saves through Save Chart.
flowchart Making tea
Thirsty? [start] -> Boil the kettle -> Tea or coffee?
Tea or coffee? -> Steep the tea: tea
Tea or coffee? -> Brew the coffee: coffee
Steep the tea -> Enjoy [end, good]
Brew the coffee -> Enjoy
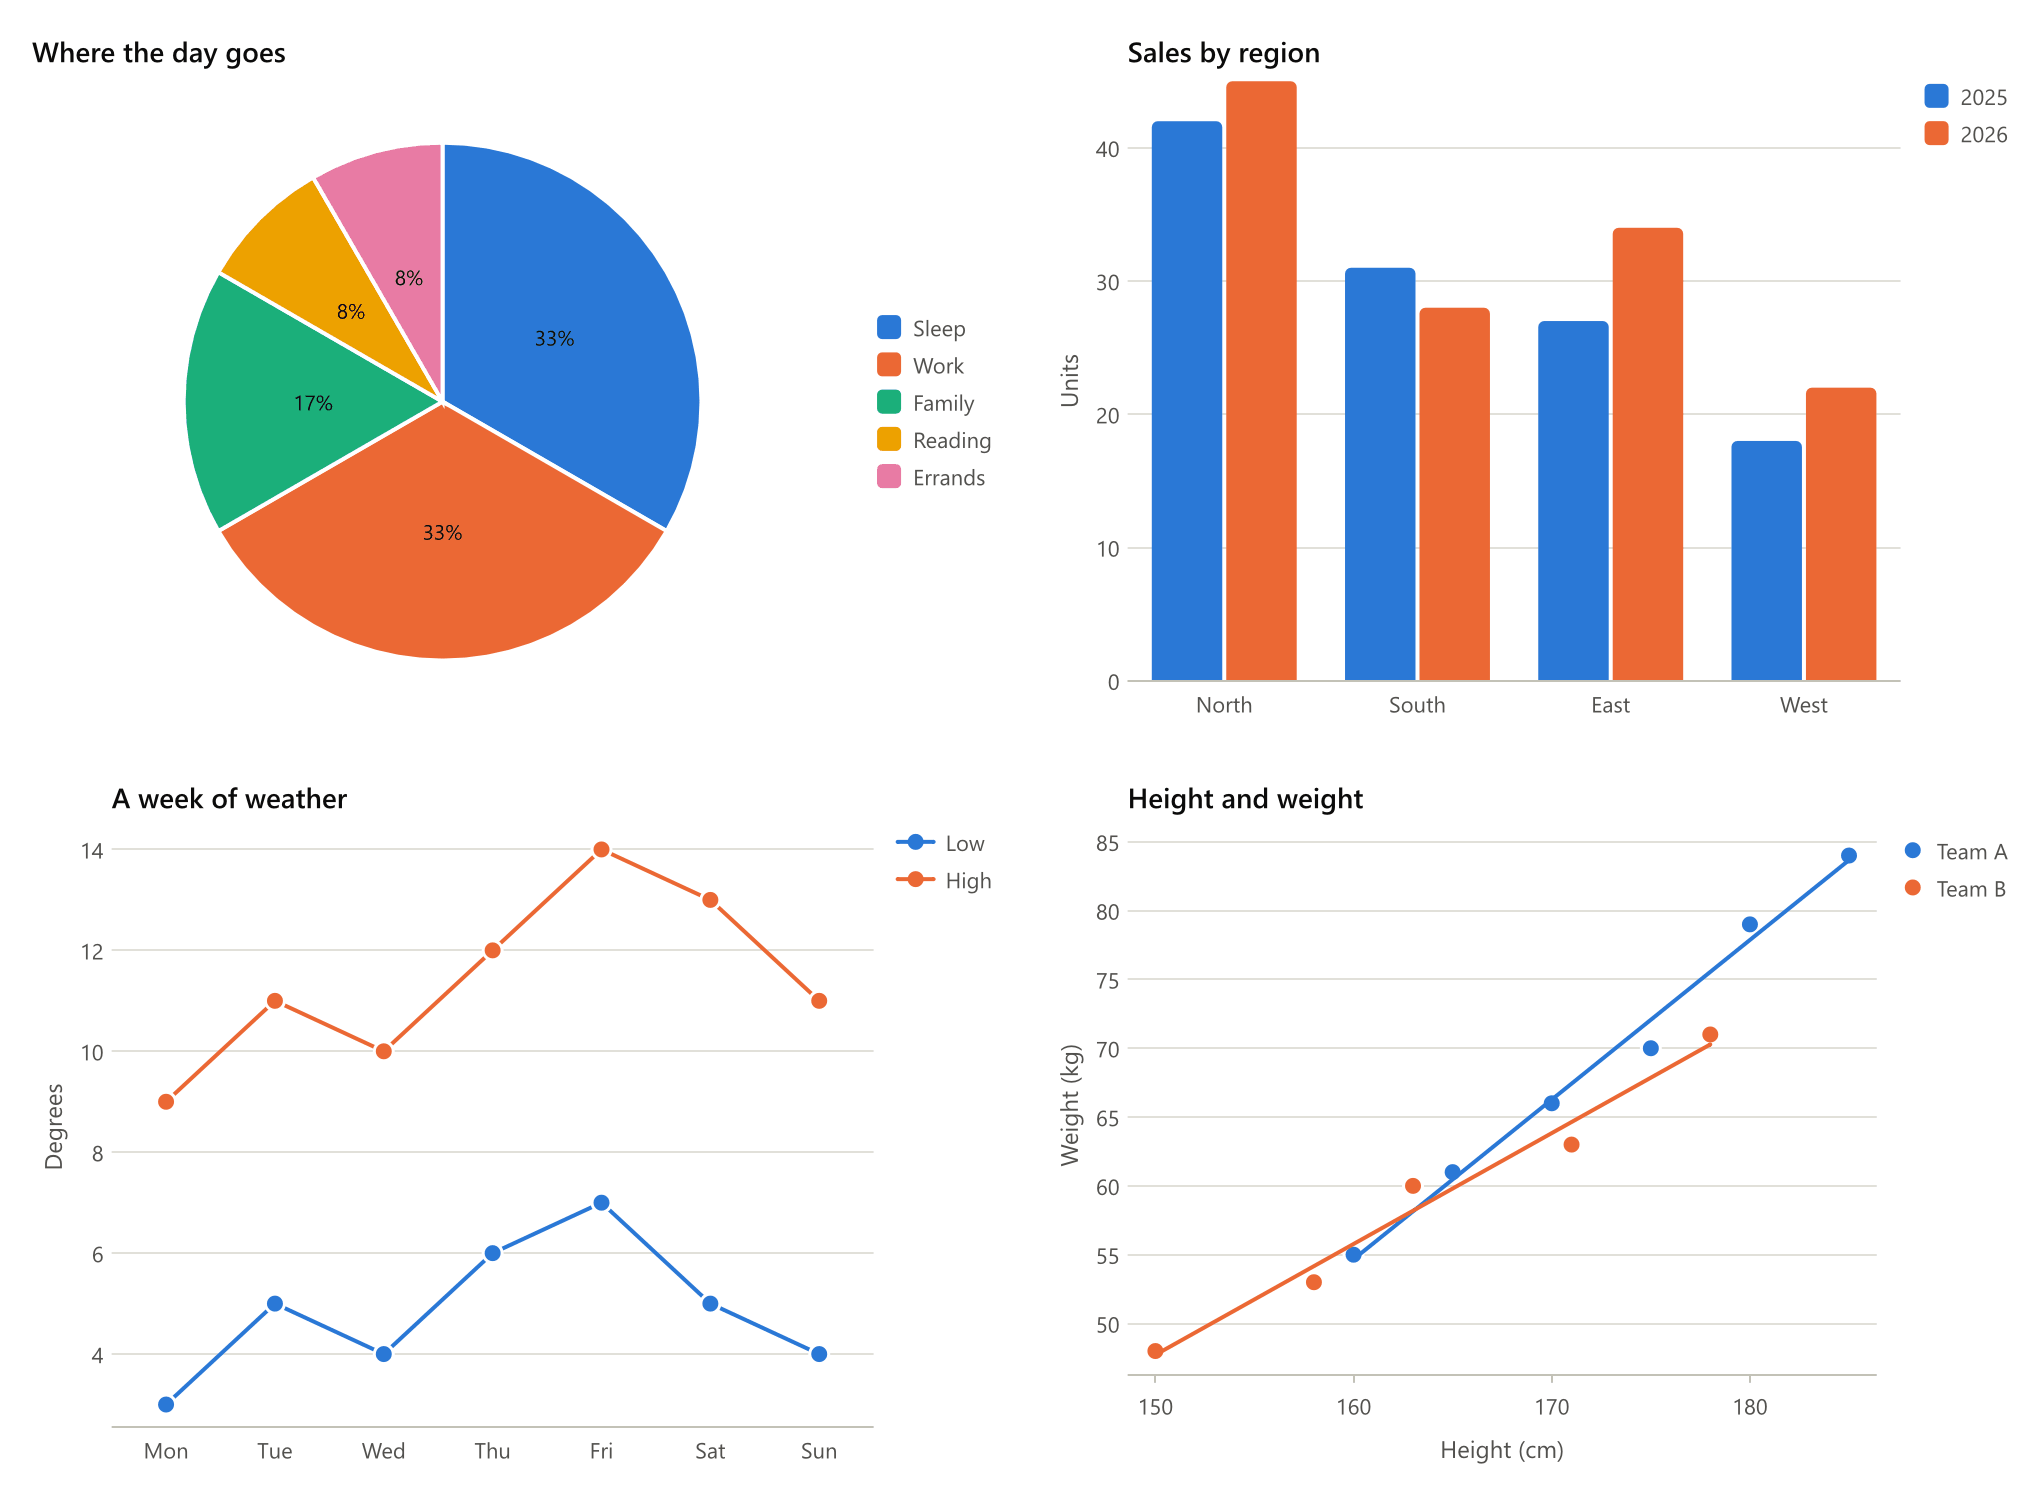
A line of three dashes puts several charts in one text, drawn side by side:
The tutorial starts from an example in Divooka Compute.
References
- Some additional tools: Utilities
- RFC: RFC 025