
Charts
Impulse, Formula and Expo share one chart engine and one chart editor, so a chart behaves the same in a document, a workbook and a deck, and the charts Word, Excel and PowerPoint write open as charts in each.
Making a chart
- Formula: select the data and choose Insert ▸ Chart. The chart follows its cells: change a figure and it changes, and a chart over a table takes in rows added to the table.
- Impulse and Expo: Insert ▸ Chart places a sample chart and opens it in edit mode, where Edit Data replaces the sample's numbers with yours.
Edit mode
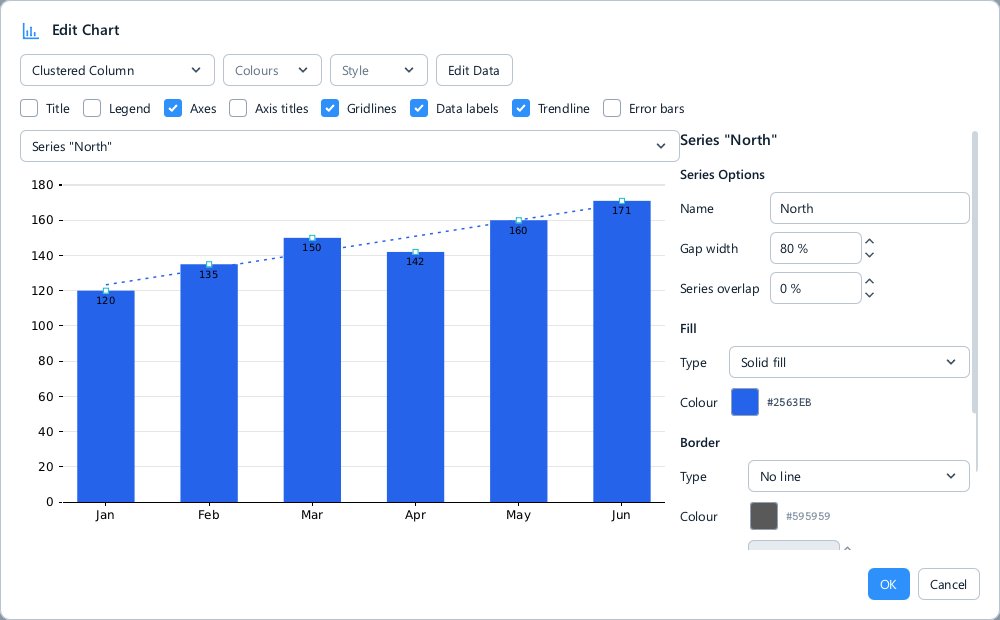
Double-click a chart, or choose Edit Chart… on its right-click menu, to edit it in the Edit Chart window. The chart is shown large, and every part of it can be selected:
- Click an element to select it: the chart area, the plot area, the title, the legend, an axis or its title, gridlines, a series, its data labels, a trend line or error bars. Click a selected series again to select one point of it. The Chart element list selects them too, including ones too small to click.
- The Format pane beside the chart shows what Office's Format pane shows for the selected element: its fill and outline (colour, width and dash), its text and font, an axis' bounds, units, scale and number format, the legend's position, which fields a data label shows and where, a pie's first-slice angle and explosion, and a trend line's or error bar's options.
- Change Chart Type changes the whole chart, or only the selected series.
- Change Colours recolours the series with one of the palettes (Office, Colourful, Vivid, Blue, Green, Orange, Grey), and Chart Styles gives the chart a look (Standard, Shaded, Outlined, Minimal, Dark).
- The element switches turn the title, axes, axis titles, gridlines, legend, data labels, trend line and error bars on and off.
- Edit Data opens the chart's numbers; see below.
Everything you do in edit mode is made to a copy of the chart: OK puts it in the document as one undo step, and Cancel leaves the document as it was. What the editor does not change, it writes back as the file had it.
Editing the data as a sheet
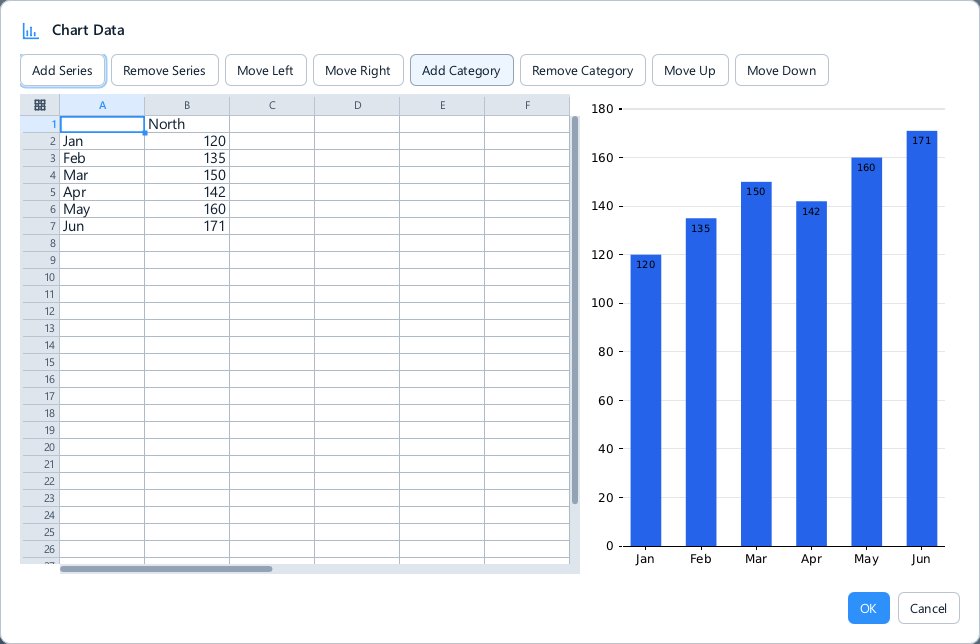
In Impulse and Expo, Edit Data opens the chart's numbers in the Chart Data window as a sheet, with the series names across the top and the categories down the side. Type over any value or name, and add, remove and reorder series and categories with the buttons over the sheet; the chart beside it follows as you type. On OK the sheet becomes the chart's embedded workbook, so Word's, PowerPoint's and LibreOffice's own Edit Data open the numbers you typed. The embedded workbook is replaced by that one sheet rather than edited where it was.
In Formula a chart's data is the cells it is drawn from, so Edit Data in the editor opens Data Ranges, which chooses those cells.
Trend lines
Select a series and choose Add Trendline, or turn on Trendline among the element switches. A trend line is one of six kinds: Linear, Exponential, Logarithmic, Polynomial (with its order), Power and Moving Average (with its period). Its options can forecast it forward or backward, fix where it crosses the axis, and show its equation and R² on the chart, in the number format you give them. In the legend it is named as Excel names it, such as Linear (Sales). Trend lines that Word, Excel or PowerPoint wrote are drawn and saved back with all of this.
Error bars
Turn on Error bars among the element switches, or select a series' error bars, to set their Direction (both, plus or minus), their End cap, and the Error amount: a fixed value, a percentage, a number of standard deviations or the standard error. Error bars of every kind Office files carry are drawn, custom values among them.
Scatter charts
A scatter chart draws each point as a marker in its series' colour, with the marker's own fill and outline, whether or not a line joins the points; a series with no line still shows its markers. Value axes are labelled at the interval the file gives, or the one LibreOffice would choose.
Not there yet
Office's newer chart types (box and whisker, waterfall, treemap, sunburst, funnel and the like), combination charts with a secondary axis, and 3-D charts.