
Sankey Diagrams
A Sankey diagram shows where a quantity comes from and where it goes. It starts with sankey and its title.
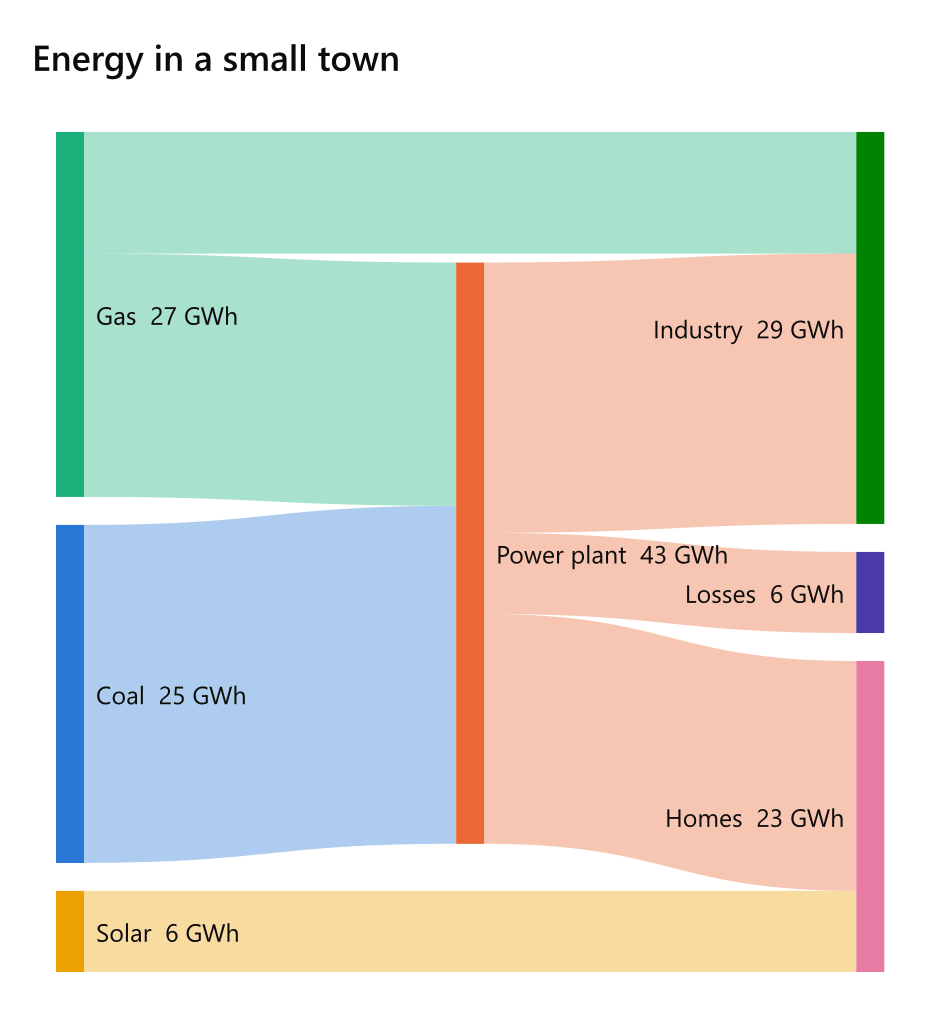
sankey Energy in a small town
unit: GWh
Coal -> Power plant: 25
Gas -> Power plant: 18
Solar [yellow] -> Homes: 6
Power plant -> Homes: 17
Power plant -> Industry: 20
Power plant -> Losses: 6
Gas -> Industry: 9
Settings
| Setting | Also | Value |
|---|---|---|
unit |
units |
written after every amount: GWh, t, people |
amounts |
values, numbers |
off to write only the nodes' names; on by default |
Flows
Each line is a flow: where from, an arrow, where to, a colon and how much. A node is made where it is first named. Mermaid's comma-separated Coal, Power plant, 25 is read as well.
A colour in brackets after a node's name colours the node and the bands that leave it - Solar [yellow] -> Homes: 6 - and one after the amount colours that band alone: Gas -> Industry: 9 [red].
A flow that is not above zero is warned of and left out. Flows that go round in a circle are said, and the one that closes the circle is left out: a Sankey diagram flows one way.
How it is drawn
Each node is as tall as what passes through it and each band as wide as its flow. The nodes stand in columns by how far they are from a source, and are ordered to keep the bands from crossing.