
象限圖
象限圖在一個被分成四份的正方形上,按兩項指標來放置事物。它以 quadrant 及其標題開頭。
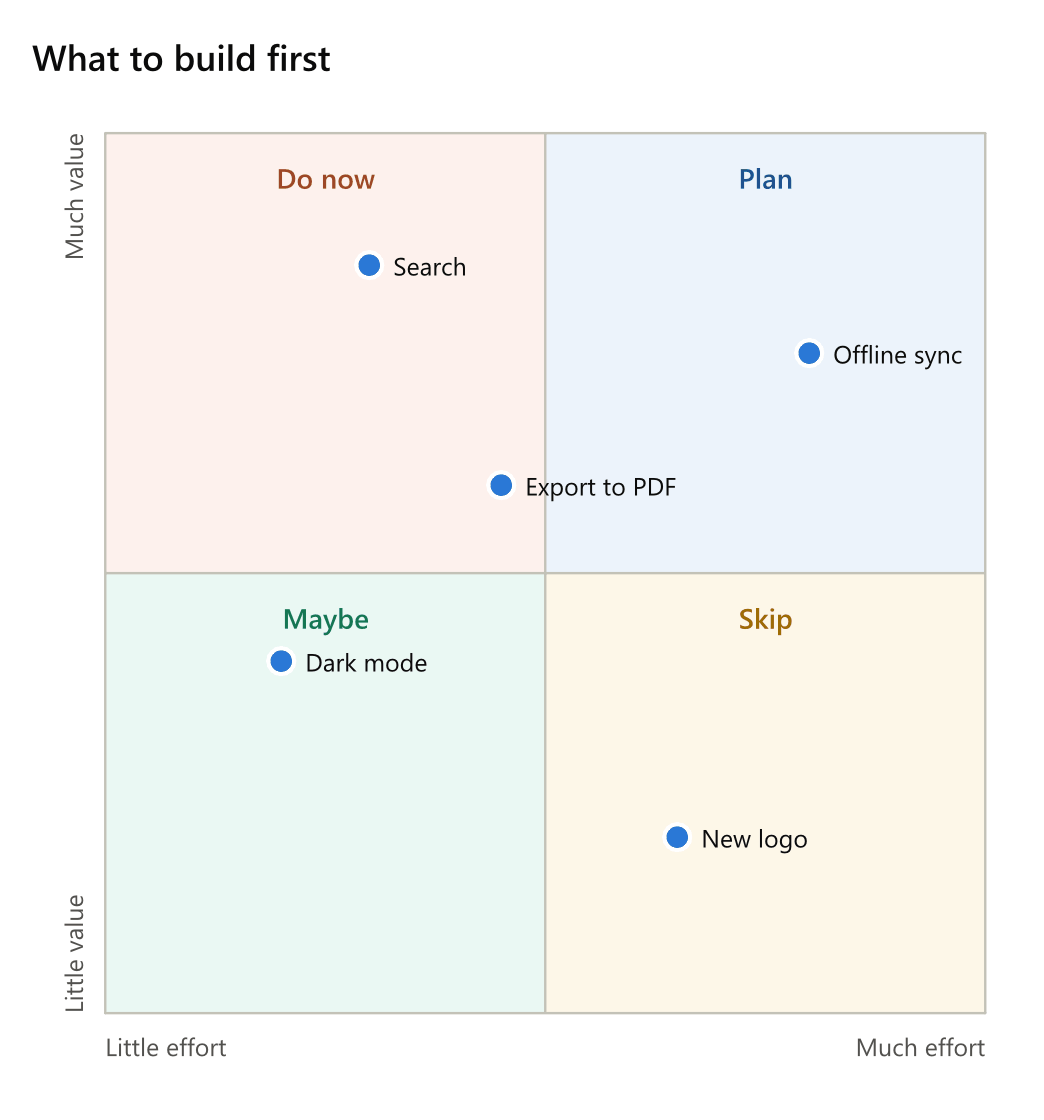
quadrant What to build first
x axis: Little effort .. Much effort
y axis: Little value .. Much value
top left: Do now
top right: Plan
bottom left: Maybe
bottom right: Skip
Search: 0.3, 0.85
Dark mode: 0.2, 0.4
Offline sync: 0.8, 0.75
New logo: 0.65, 0.2
Export to PDF: 0.45, 0.6
設定
| 設定 | 別名 | 值 |
|---|---|---|
x axis |
x, horizontal, xaxis |
座標軸的低端和高階,以 ..、->、--> 或 to 分隔 |
y axis |
y, vertical, yaxis |
同上,方向向上 |
top right |
quadrant 1, q1 |
右上象限的名稱 |
top left |
quadrant 2, q2 |
左上象限的名稱 |
bottom left |
quadrant 3, q3 |
左下象限的名稱 |
bottom right |
quadrant 4, q4 |
右下象限的名稱 |
range |
兩條座標軸的範圍:0..1(預設)、0..10、0..100 |
各象限按 Mermaid 的方式編號,從右上開始,依次繞到右下。
資料點
每一行是一個資料點:一個名稱、一個冒號和它的兩個值,先橫向後縱向。值的兩側可以加括號 —— Search: (0.3, 0.85) —— 名稱後方括號中的顏色會為該點著色:Dark mode [teal]: 0.2, 0.4。超出範圍的資料點會繪製在邊緣處,並收到警告。