Dhole
Availability: (Divooka™ Explore) Plotting > Dhole Status: Early Alpha Support Tier: Tier 2
Dhole provides a text-based way to drawing charts. It works like Mermaid for Markdown/JavaScript. The power of Dhole really shows up when embedded in document texts, e.g. in the case of book writing.
Screenshots

Example Charts
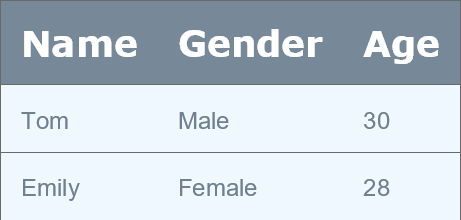
Table:
  # Header row
  Headers: Name, Gender, Age
  # Rows in CSV
  Tom, Male, 30
  Emily, Female, 28
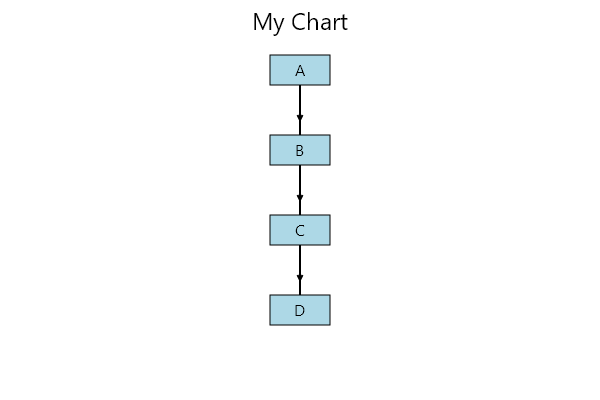
Flowchart:
  Orientation: TopDown
  Title: My Chart

  # Elements
  A
  B
  C

  # Connections
  A -> B
  B -> C
  C -> D
Mindmap:
  root
    Origins
      Long history
      Popularisation
        British popular psychology author Tony Buzan
    Research
      On effectiveness
      On Automatic creation
        Uses
            Creative techniques
            Strategic planning
            Argument mapping
    Tools
      Pen and paper
      Mermaid
PieChart:
  Title: Fruits
  Slice: Apples, 30
  Slice: Oranges, 20
Timeline:
  Title: My Project
  2025-01-01, Start
  2025-03-15, Phase1
  2025-06-30, Release
XY-Chart:
  Title: Points
  X: 0,1,2,3
  Y: 10,12,14,20
Radar:
  Title: My Radar
  Series: 10,20,30
  Series: 15,25,28
Quadrant:
  Title: Q
  (1,2), (3,4), (5,6)
Kanban:
  Title: MyBoard
  Column: Backlog
  Task1
  Task2
  Column: In Progress
  Task3
  Task4
Example Code Use
// Render from text
var pixelImage = Dhole.DholePlot.DrawTextBased(script);

// Or you can build a strongly typed definition by hand:
var flow = new FlowchartDefinition()
{
    Title = "Manual Flow",
    Orientation = "LeftRight",
    Nodes = new List<string> { "N1", "N2", "N3" },
    Connections = new List<(string, string)>
    {
        ("N1","N2"),
        ("N2","N3")
    }
};
var flowImg = Dhole.DholePlot.RenderChart(flow);